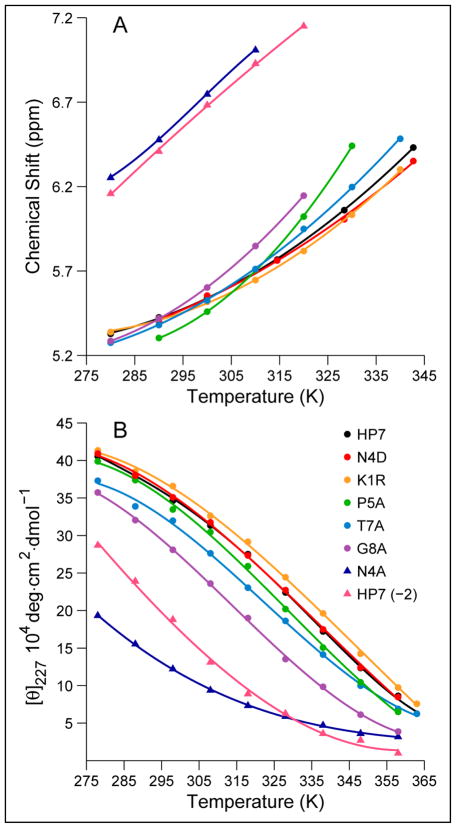
Figure 6.
Representative melting studies of a series of HP7 analogs. A. The temperature dependence of the most upfield aryl-H signal (Hε3 of W3), B. CD melts of the same series; the observed “adjusted-[θ]227” (see Methods) values for (K1R)-HP7 and (N4D)-HP7 are multiplied by factors of 1.14 and 1.07, respectively, to raise them just above the values recorded for HP7 since all other data indicates that these analogs are at least as well-folded as the parent system. The fitted curves in panel B are fourth order polynomials, rather than based on a folding model; presumably they capture the curvature of the experimental data and can be used to obtain Tm values by the second derivative method.

