
Figure 4.
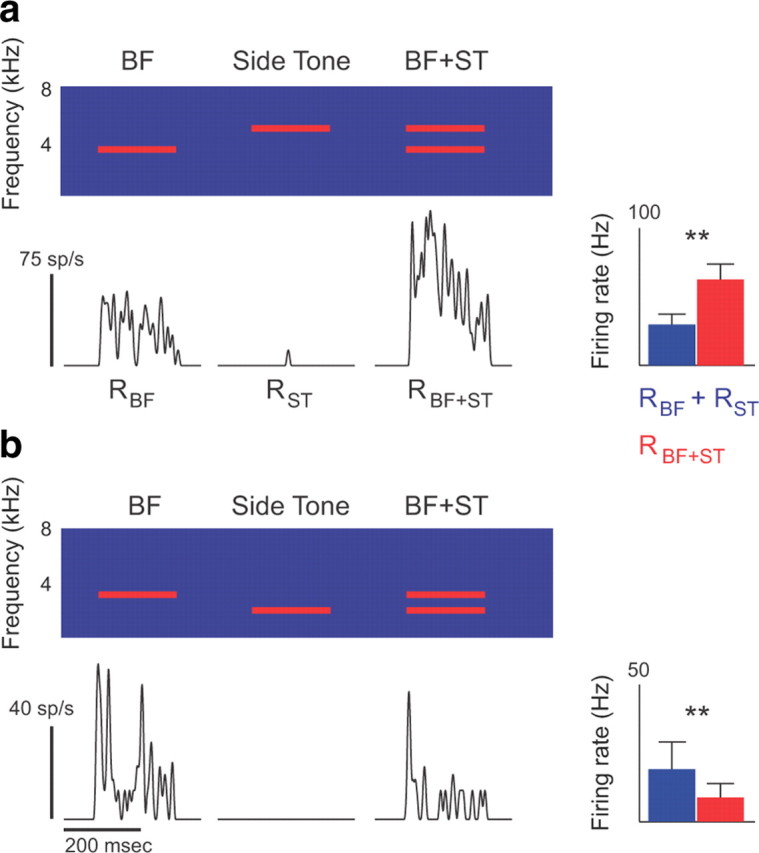
Paired tones reveal extra-classical excitation and inhibition. a, b, The top panel shows the spectrogram of three successive stimuli: a pure tone at the neuron's BF, a side tone (ST) near the BF but outside of the CRF, and the two tones presented simultaneously. The black PSTHs below show the average neural response to each stimulus. The bar graphs at the right show the firing rates in response to multiple presentations of tone pairs (RBF+ST, red; mean + SD), and the sum of firing rates in response to the two tones (BF and ST) played independently (RBF + RST, blue). In a, the tone pair produced significantly higher firing rates than predicted by the two tones played independently, indicating extra-classical excitation. In b, the tone pair produced significantly lower firing rates, indicating extra-classical inhibition.