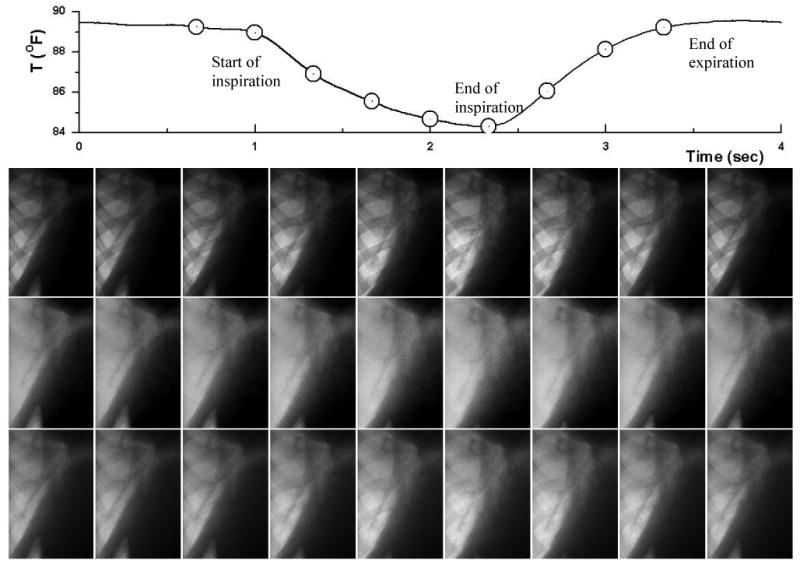
Figure 4.

A sequence of low energy (upper row), soft-tissue (middle row) and high energy (bottom row) images. Images from left to right capture the different time point along the breathing cycle (indicated by the circles on the respiratory surrogate signal plot at the top).
