
Figure 5.
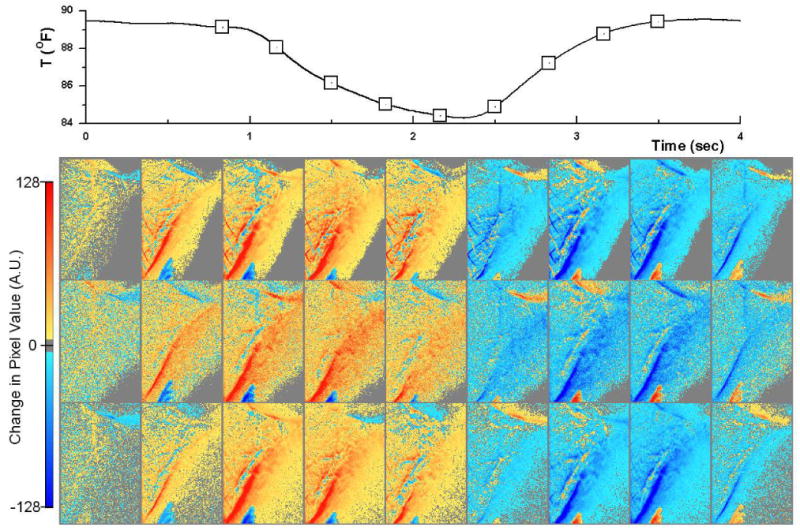
Time subtracted sequences for low energy (upper row), soft tissue (middle row) and high energy (bottom row) images. The gray color indicates no change in pixel values between the two sequential frames, yellow to red indicates an increase in pixel values. The blue color indicates a decrease. The time point of each frame is also indicated by the squares on the respiratory surrogate signal plot at the top.