
Figure 1.
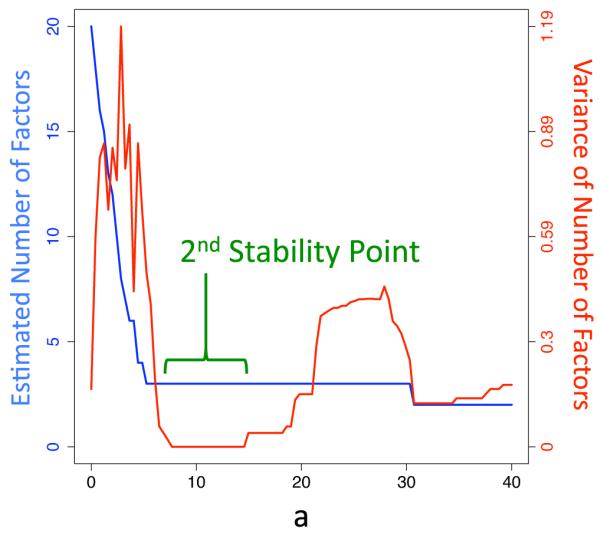
A plot of the estimated number of factors (blue and left axis) and the empirical variance of the estimate for varying set sizes (red and right axis) across a range of coefficients a. The second stability point (green bracket) is the second point, moving from left to right, where the variance finds a trough. Hallin & Liska (2007) suggest using the estimate corresponding to this second stability point as a practical estimator of the number of factors.