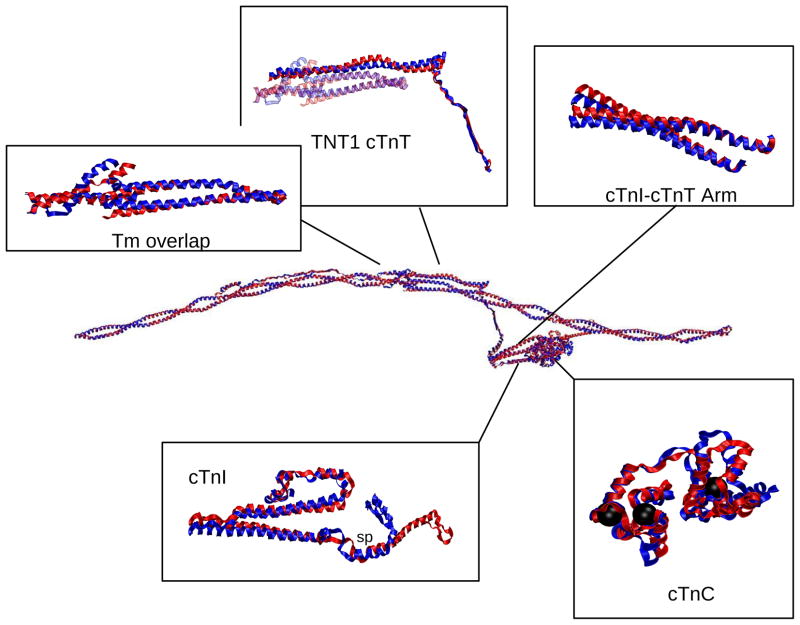
Figure 8.
Alignment of Ca2+-saturated and Ca2+-depleted average structures of the complete cTn complex with overlapping Tm and highlighted regions of interest. The color scheme for this and the other structural images is: Blue=Ca2+-saturated; Red=Ca2+-depleted. In cTnC, the black spheres are the locations of calcium ions. In cTnI box, “sp” = switch peptide.

