
Figure 3.
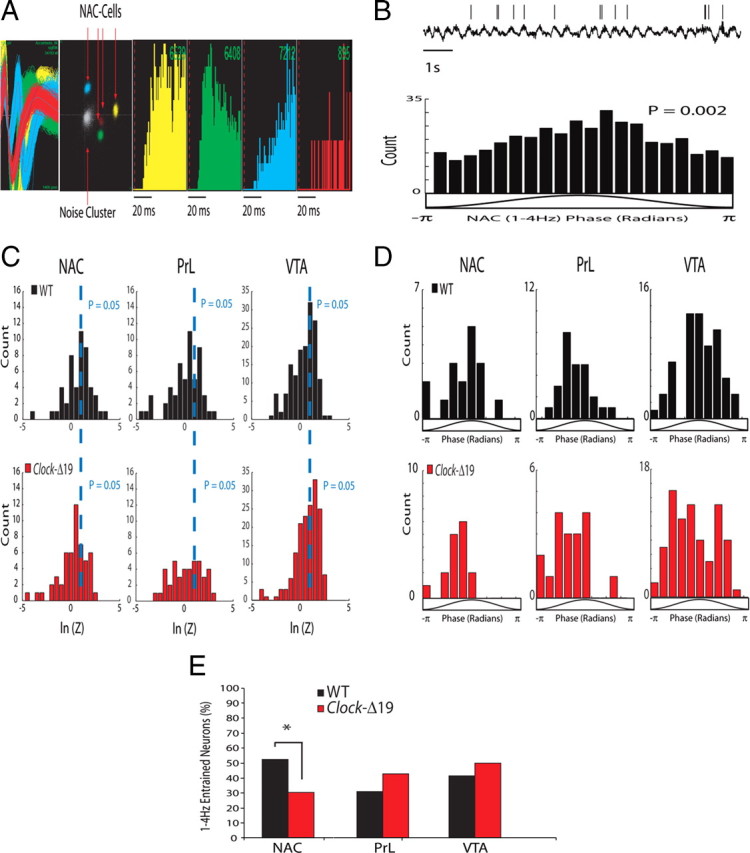
Neuronal phase locking across mesolimbic brain areas in WT and Clock-Δ19 mice. A, Example of four neurons isolated from NAC. From left to right: depiction of the four extracellularly recorded waveforms of the unit (x-axis 1400 μs; y-axis 188 μV); projection of the clusters correspondent to the units and the noise based on analysis of the first two principal components of the waveforms recorded (x-axis, PC1; y-axis, PC2); and interspike interval histogram. B, Example of single-neuron phase locking, and the phase distribution of NAC neuron shown above. The activity of the depicted neuron was phase locked to the 1–4 Hz oscillation peak. C, Raleigh statistic for all NAC, PrL, and VTA neurons in WT and Clock-Δ19 mice. D, NAC, PrL, and VTA neurons in WT and Clock-Δ19 mice optimally phase locked to the rising phase of delta oscillations. E, Clock-Δ19 mice displayed a significantly lower proportion of NAC neurons that were phase locked to delta oscillatory activity than did WT mice. Two-tailed paired z test with FDR correction, *Corrected P < 0.05.