
Fig. 4.
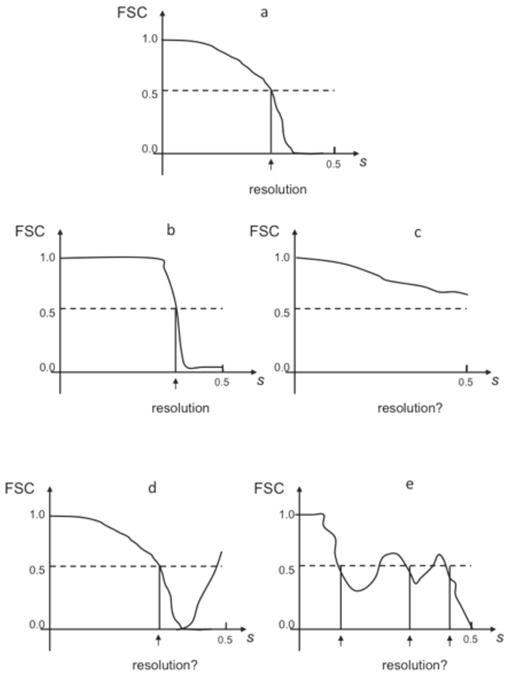
Typical FSC resolution curves encountered in practice of SPR. s - magnitude of spatial frequency with 0.5 corresponding to Nyquist frequency. (a) proper FSC curve remains one at low frequencies, which is followed by a semi-Gaussian fall-off (see Eq.24) and a drop to zero at around 2/3 of Nyquist frequency, in high frequencies oscillates around zero. (b) Artifactual “rectangular” FSC: remains one at low frequencies remains one, followed by a sharp drop, in high frequencies oscillates around zero. Typically it is caused by a combination of alignment of noise and a sharp filtration during the alignment procedure. (c) The FSC never drops to zero in the entire frequency range. Normally, this means that the noise component in the data was aligned, the result are artifactual and the resolution is undetermined. In rare cases it can also mean that the data was severely undersampled (very large pixel size). (d) After the FSC curve drops to zero, it increases again in high frequencies. This artifact can be caused by the low-pass filtration of the data prior to alignment, errors in the image processing code, mainly in interpolation, by the erroneous correction for the CTF, including errors in estimation of SSNR, and finally, incorrect parameters in 3D reconstruction programs (for example iterative 3D reconstruction was terminated too early). It can also mean that all images were rotated by the same angle. (e) FSC oscillates around 0.5. It means that data was dominated by one subset with the same defocus value or there is only one defocus group. The resolution curve is not incorrect per se, but it is unclear what the resolution is. The resulting structure will have strong artifacts in real space.