
Figure 1.


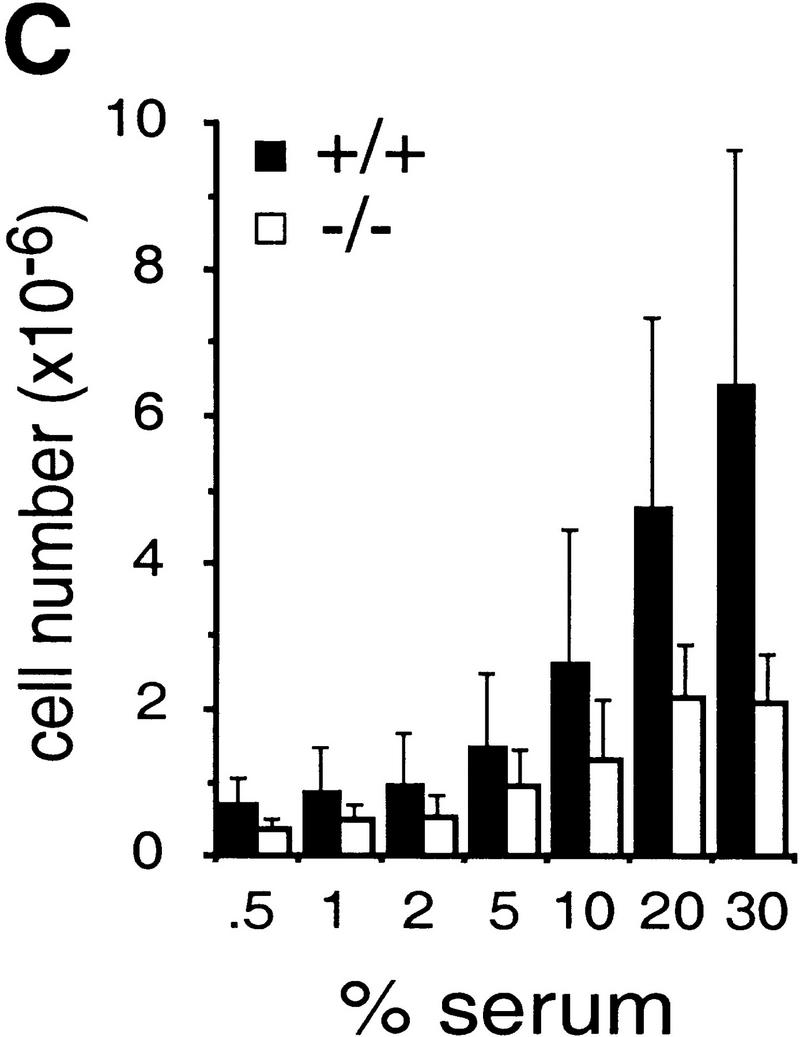


Growth properties of primary and immortalized fibroblasts lacking c-Jun. (A) Proliferation curves of wild-type (+/+), c-jun+/−, and c-jun−/− primary fibroblasts (MEFs; passage 1). The average ±s.d. numbers of cells isolated from three individual embryos of each genotype are shown, each determined in triplicate. (B) Proliferation curves of five independently established 3T3 fibroblast lines lacking c-Jun (−/−) and three corresponding wild-type 3T3 fibroblast lines (+/+). Cells were counted and passaged at 3-day intervals and cumulative cell numbers determined. (█) Standard NIH-3T3 fibroblasts obtained from ATCC. (C) Saturation densities of wild-type (+/+) and mutant (−/−) 3T3 fibroblasts as a function of serum concentration. Cells were counted after 13 days of culture in the presence of the indicated concentrations of fetal calf serum. Each point represents the average ±s.d. of two wild-type and three c-jun−/− cell lines, respectively. (D) Determination of the duration of the cell cycle of wild-type (+/+) and c-jun−/− 3T3 fibroblasts (−/−). [3H]thymidine was added to exponentially growing, asynchronous cultures, and cells were fixed and analyzed at various times after continuous thymidine incorporation (cumulative labeling). Each point represents the average ±s.d. of two independent cell lines of each genotype. (E, F) Parallel quantitative analysis of G1-to-S-phase progression (E) and cell growth (F) in wild-type (+/+) and c-jun−/− 3T3 fibroblasts (−/−) at the indicated times after serum stimulation of G0-synchronized cells (see Materials and Methods). Percentage of cells exiting G1 (i.e., the percentage of cells in S, G2, or M) was quantified by propidium iodide staining and FACS analysis. Cell volumes and cell numbers were determined in parallel with a CASY1 cell counter. The average of two independent cell lines of each genotype is shown.