
Figure 4.
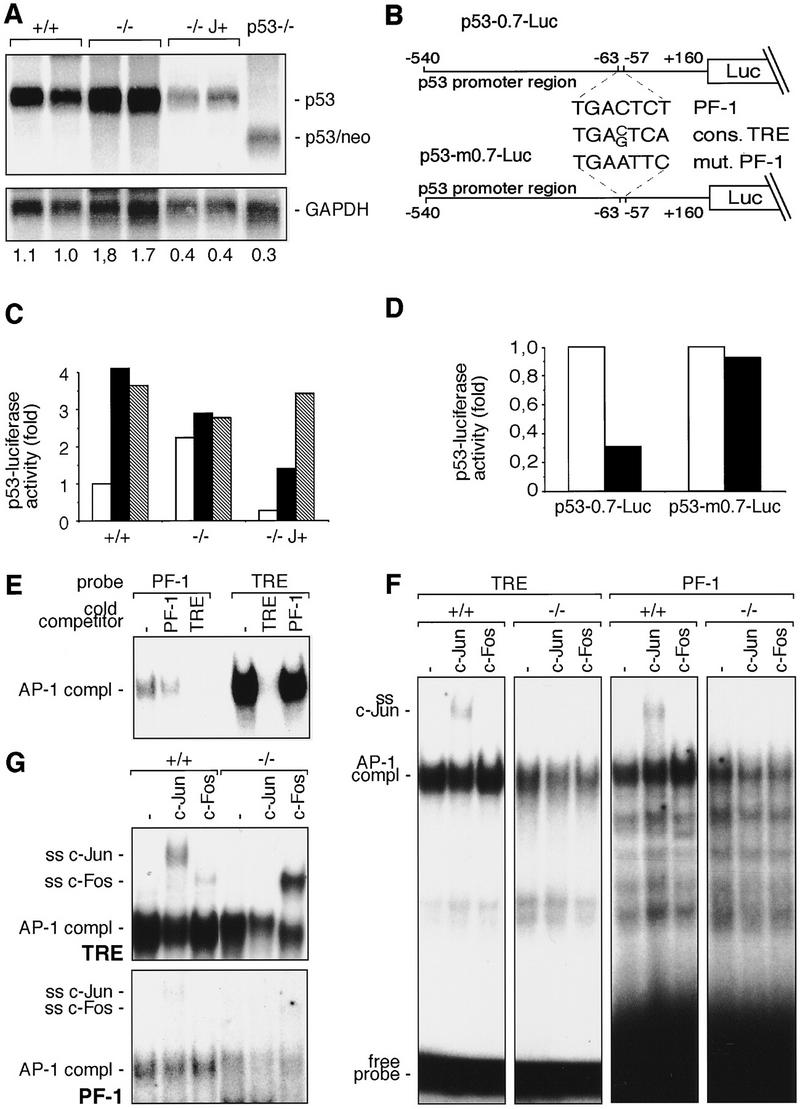
c-Jun binds to and represses the p53 promoter. (A) Northern blot analysis of p53 mRNA in two wild-type (+/+), two c-jun−/− (−/−), two c-Jun-overexpressing (−/− J+), and one p53−/− 3T3 fibroblast lines. Poly(A)+ RNA from untreated cells was separated on an agarose gel, transferred to Hybond N+ (Amersham) membrane, and probed with p53 and GAPDH cDNA probes. The intensities of bands were quantified with a PhosphorImager, and relative levels of p53 mRNA, normalized to GAPDH, are indicated at the bottom of each lane. (B) Schematic representation of the p53 promoter–luciferase reporter constructs used. p53-0.7–Luc contains a 700-bp fragment of the mouse p53 promoter region, which contains the PF-1 element (Ginsberg et al. 1990). p53-m0.7–Luc contains a mutated version of PF-1 (mut. PF-1). The consensus AP-1-binding site (cons. TRE) is shown for comparison. (C) p53-0.7–Luc (open bars), p53-m0.7–Luc (solid bars), or pGL2–Luc (shaded bars) (an unrelated control luciferase construct) was transfected into wild-type (+/+), c-jun null (−/−), and c-Jun-overexpressing (−/− J+) 3T3 fibroblasts, and luciferase activity was measured. (D) p53-0.7–Luc or p53-m0.7–Luc was cotransfected into wild-type 3T3 fibroblasts together with a c-Jun expression vector (solid bars) or empty expression vector (open bars), and luciferase activity was measured. Relative luciferase activities from one representative experiment performed in quadruplicate are shown in C and D. (E–G) Protein–DNA complexes formed with the consensus AP-1-binding site (TRE of the collagenase promoter) and the PF-1 element of the p53 promoter. Nuclear extracts were prepared from exponentially growing (E,F) or TPA treated (2 hr; 100 ng/ml; G) wild-type (+/+) and c-jun−/− (−/−) fibroblasts. Nuclear extracts were incubated with the labeled probes indicated on the top and complexes were resolved by PAGE. The positions of the DNA-bound AP-1 complexes are indicated on the left. For cross-competition analysis (E) an 80-fold molar excess of non-labeled competitor DNA (indicated at top) was used. For supershift analysis (F,G), extracts were preincubated with specific antiserum (indicated at top) for c-Jun (ss c-Jun) and c-Fos (ss c-Fos), and the positions of the resulting supershifts are indicated at left. Note that in F and G the time of exposure of the PF-1 analysis was sevenfold longer compared to the result obtained with the TRE.