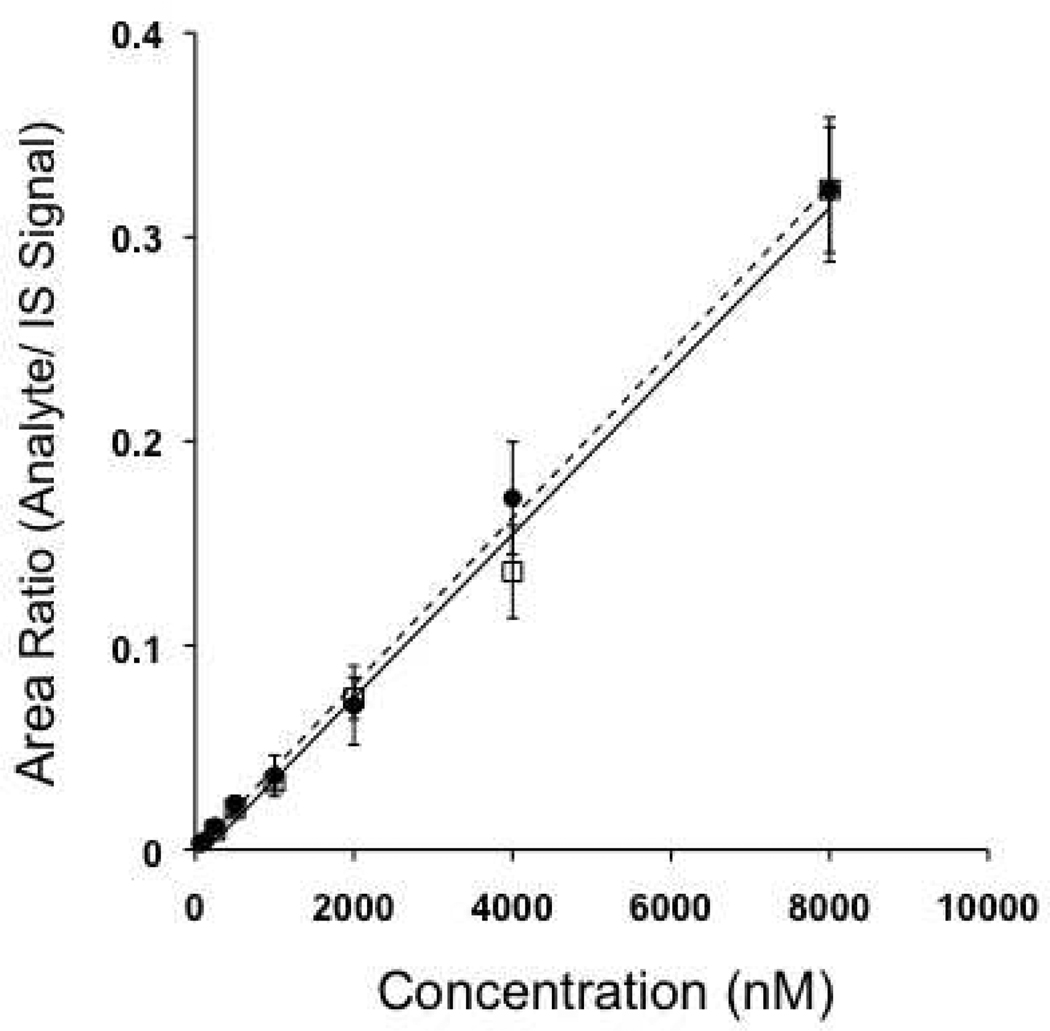
Figure 3.
Representation of standard curves for both PGE2 in solution alone (●) and PGE2 in solution with PGE2-G ( ). The equations representing the depicted regression lines are: for PGE2 alone, y = 4e-5x - 0.0008 and for PGE2 mixed with PGE2-G, y = 4e-5x - 0.005. Neither regression line differed significantly from unity (r2=0.99).

