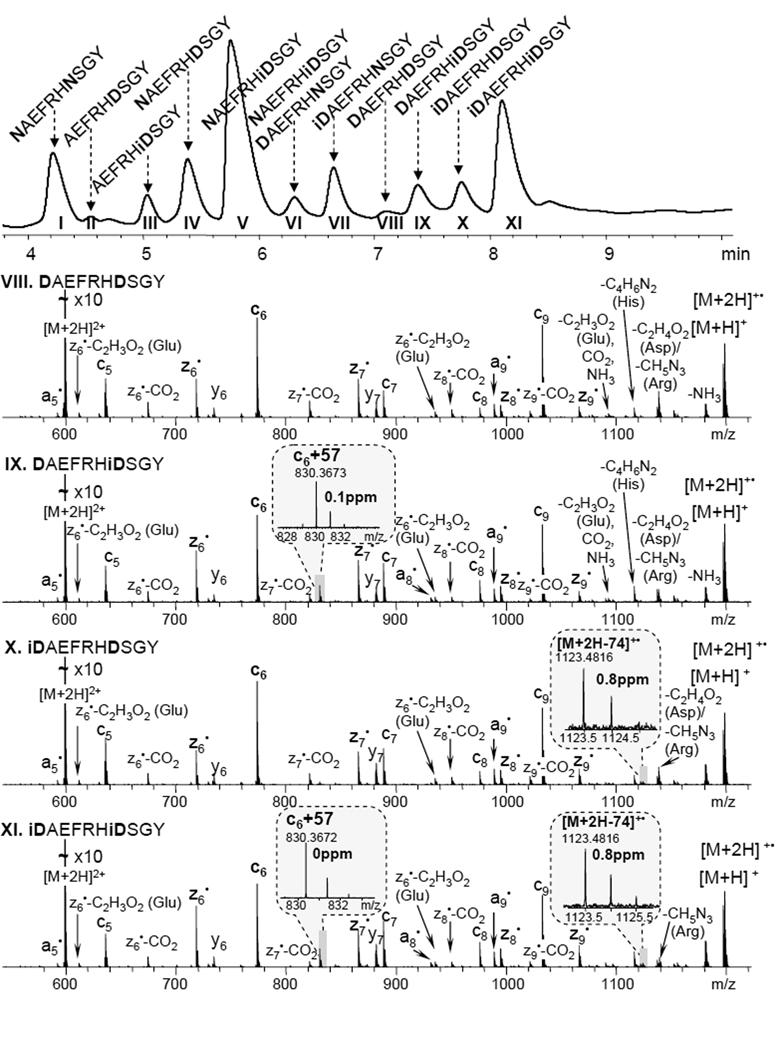
Figure 2.
Chromatogram of the peptide mixture, generated by partial deamidation of the Aβ1–10 (N1N7) peptide variant (top panel). Each chromatographic peak was labeled based on ECD results. The 4 ECD spectra shown correspond to the VIII–XI fractions with the isoAsp specific fragments indicated in the insets. Additional spectra for fractions I–VII are available in supplemental material, figure S1.

