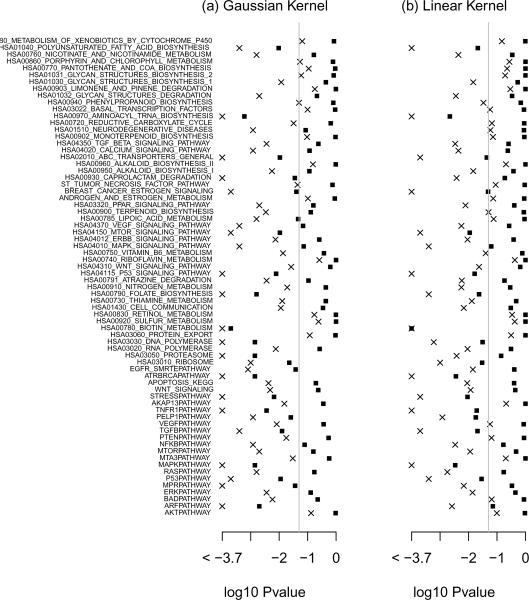
Figure 1.
log10 Pvalue for testing the overall effect of the 70 genetic pathways on breast cancer survival based on the kernel machine score test with Gaussian kernel and with the linear kernel. The crosses and the squares represent p-values before and after adjusting for multiple comparisons, respectively. The results are based on B = 5000 bperturbations.

