Figure 1.
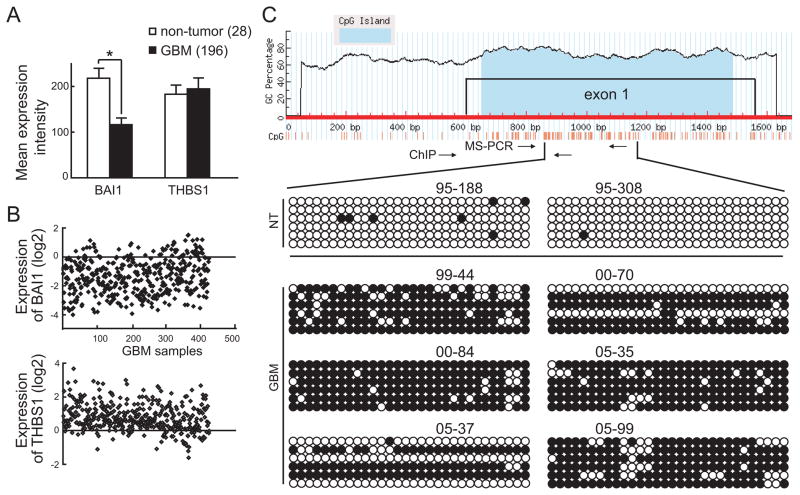
Aberrant DNA methylation at BAI1 exon 1 in GBM. A, down-regulation of BAI1 gene expression in human glioblastomas. Raw data from Rembrandt Affymetrix Human Genome HTS U133A 2.0 Array for BAI1 and THBS1 expression in 28 non-tumor and 196 GBM samples was analyzed and quantified. *, p<0.01. B, expression of BAI1 and THBS1 in 424 GBM samples from the TCGA database. The normalized expression values are expressed as log ratios (base 2) for the y-axis, each spot representing one sample (x-axis). C, analysis of CpG island methylation in the BAI1 exon 1 in human glioblastomas by bisulfite-sequencing. Top, schematic diagram indicates the structure of the BAI1 gene promoter showing the CpG island located in exon 1. The CpG island was identified by the MethyPrimer software. Bottom, bisulfite-sequencing results on 2 brain samples from non-tumor (NT) patients and 6 samples from human GBM patients are included. 6 sequenced clones per sample are shown. The methylation status of the individual CpG dinucleotides is shown by unmethylated (empty) or methylated (filled) circles.

