
Figure 3.
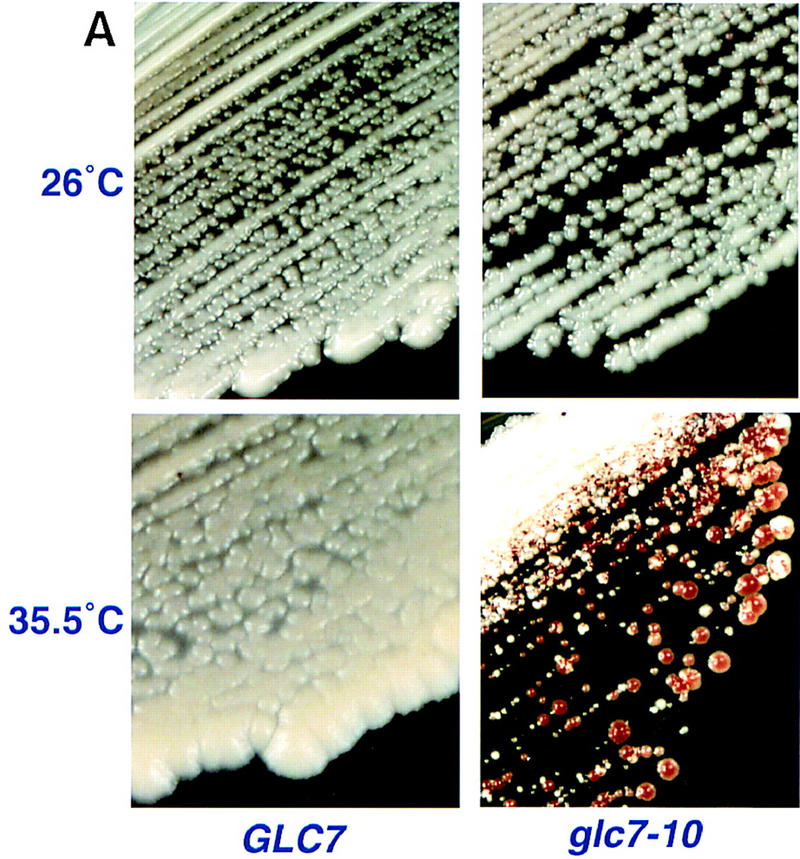

(A) Chromosome loss phenotype of glc7-10 cells at the semipermissive temperature. Chromosome loss was monitored visually by red sectored colonies after growth of strains on YPD medium at 35.5°C. (B) Chromosome loss quantitation: Fraction of total colonies that were red or sectored at 26°C, 32°C, 34°C, and 35.5°C. (The number of total colonies counted are in parentheses).