
Figure 4.
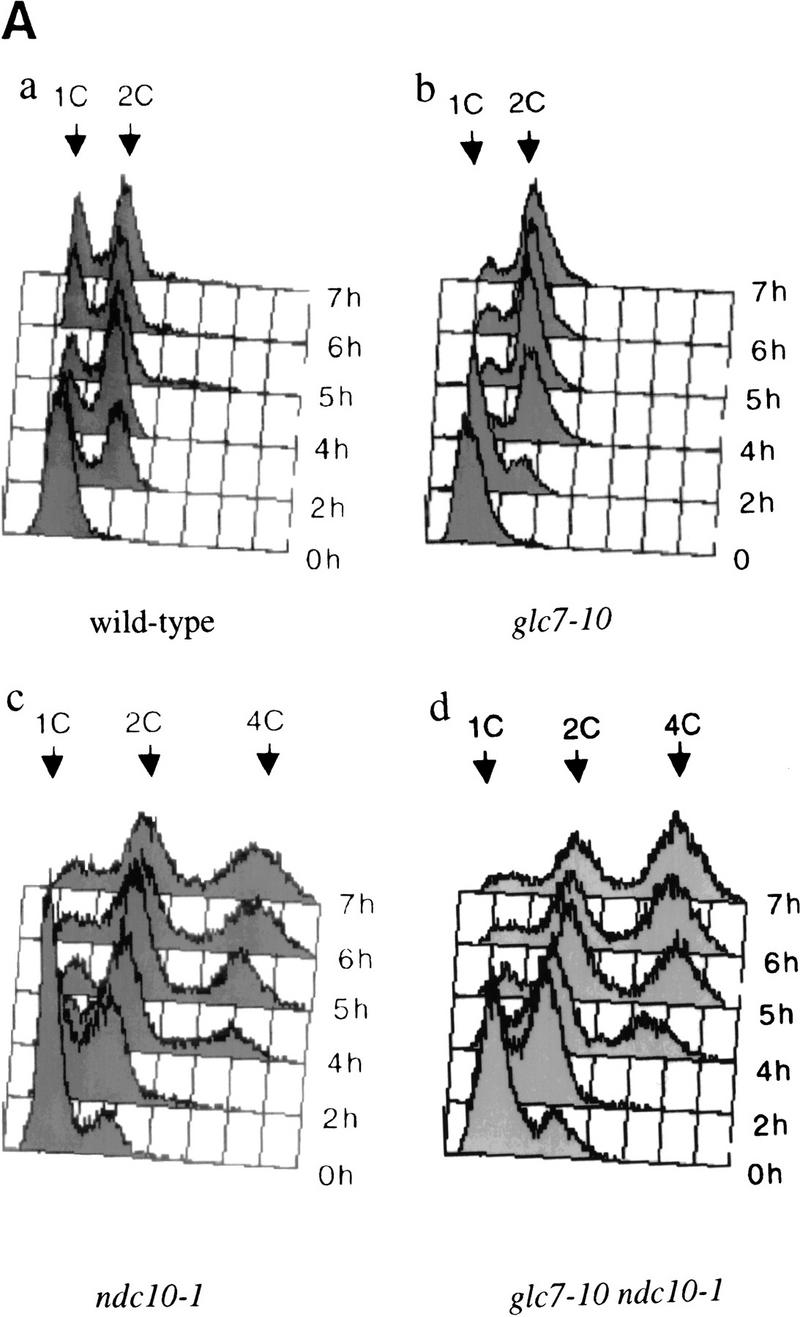

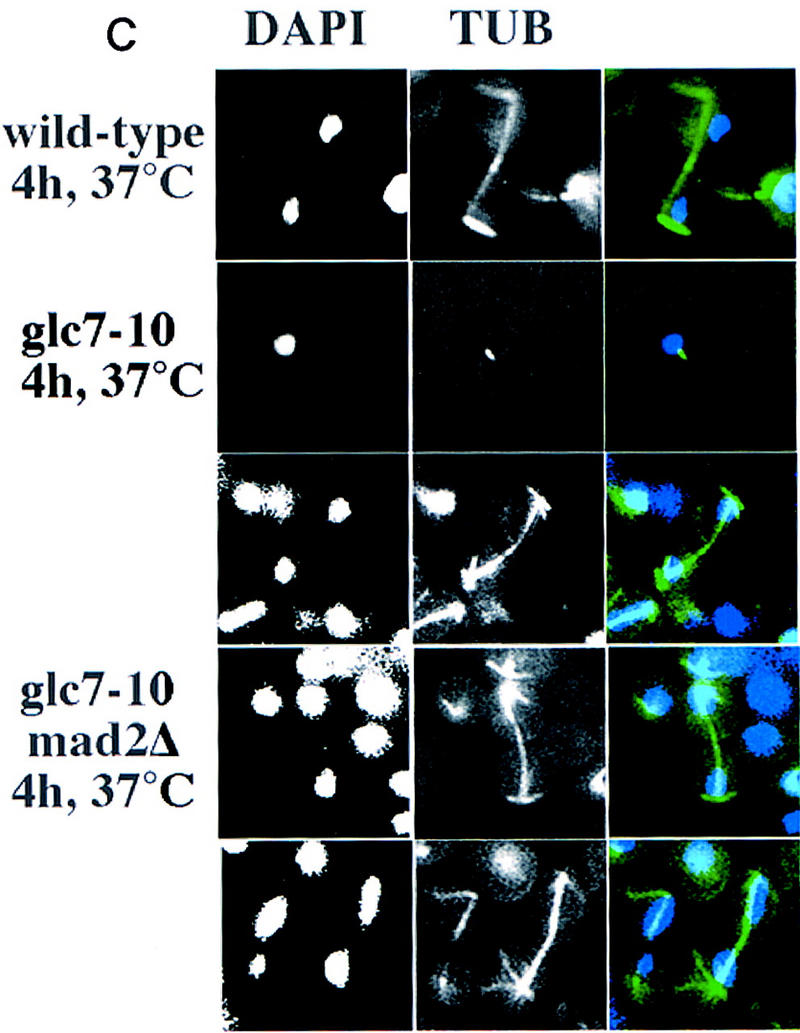
(A) DNA flow cytometry of wild-type (a), glc7-10 (b), ndc10-1 (c), and glc7-10 ndc10-1 (d) cultures synchronized by starvation on plates for 2–3 days at the permissive temperature. Samples were taken at different time points of the incubation at the restrictive temperature and processed for DNA content measurement (FACS). The arrows show whether cells have 1C, 2C, or 4C of DNA mass, corresponding to an unreplicated, a replicated, or a re-replicated genome, respectively. (B) DNA flow cytometry of mad2Δ (a) and glc7-10 mad2Δ (b) cultures synchronized by centrifugal elutriation and released in complete medium at 37°C. Samples were taken at different time points and processed for DNA content measurements. (C) Tubulin immunofluorescence was performed on wild-type, glc7-10, and glc7-10 mad2Δ double mutants shifted to the nonpermissive temperature for 4 hr. Three examples of glc7-10 mad2Δ anaphase elongated spindles are shown. (Left) DAPI staining; (middle) anti-tubulin staining; (right) merge of both stainings.