
Figure 6.
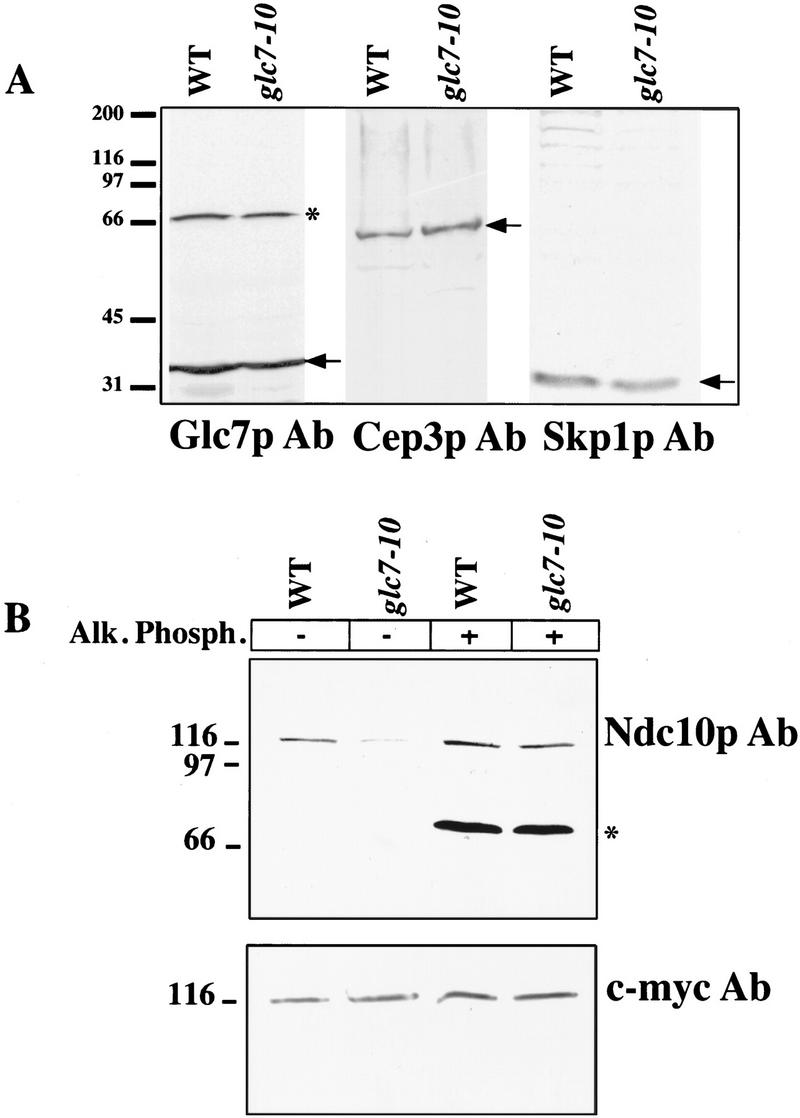
(A) Protein level comparison in glc7-10 and wild-type extracts. Extracts from wild-type and glc7-10 cultures shifted to 37°C for 3 hr were prepared and run on a 10% SDS–polyacrylamide gel. Western blots were performed with Skp1p and Cep3p purified antisera. (Arrows) Expected band: Cep3p (64 kD), Skp1p (24 kD). The same blot performed with a purified antiserum against Glc7p (37 kD) is shown as a loading control. Molecular masses (kD) of protein standards are indicated. (B) Alkaline phosphatase treatment of glc7-10 and wild-type crude extracts. Both wild-type and glc7-10 strains used contained a c-myc-tagged integrated version of NDC10. Both extracts were made after shifting of the cultures to the restrictive temperature for 3 hr. Subsequently, they were treated with alkaline phosphatase and blotted with Ndc10p and c-myc antisera. (*) Cross-reacting bands unrelated to our study. Molecular masses (kD) of protein standards are indicated.