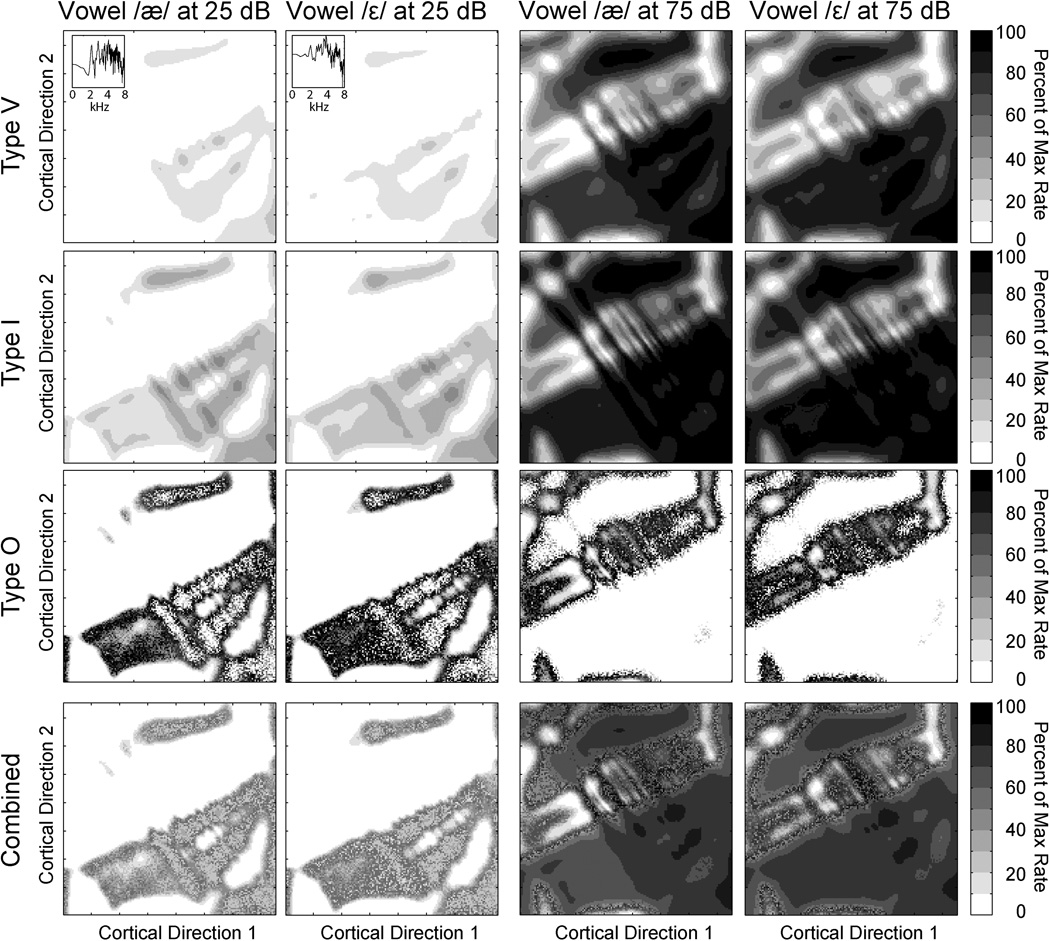
Figure 7. Simulated functional imaging results for two vowels at two different intensities.
Simulated functional imaging experiments for the A1 feature maps in Figure 6 applied to the neuronal subtypes depicted in Figure 5. In this case two steady-state vowels (spectra shown in insets) were presented to the model network at two different intensities. At low intensities, Type V neurons are actually the most selective and result in the least overall activation. They become the least selective at high intensities, however. Type I neurons might be expected to be visibly more selective than Type V neurons at high intensities, but do not appear to be so with these wideband sounds. Type O neurons unsurprisingly show no change in selectivity at different intensities. The most striking result is that in all neuronal subpopulations and their combination, activity patterns are most similar between two perceptually different stimuli at the same intensity.

