
Fig. 1.
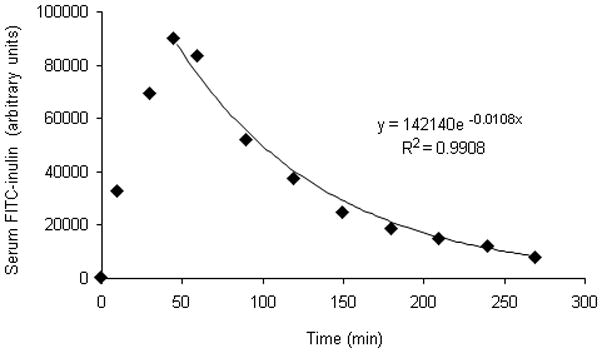
Dynamic changes of circulating FITC-inulin following single-bolus intraperitoneal injection. FITC-inulin (3 mg) dissolved in PBS 1 ml was injected intraperitoneally to C57B6 adult male mice. The changes of FITC-inulin concentrations over time were monitored in the serum. The result of a typical experiment is demonstrated in the plot and the exponential curve fitting was performed using Excel-07.