
Fig. 3.
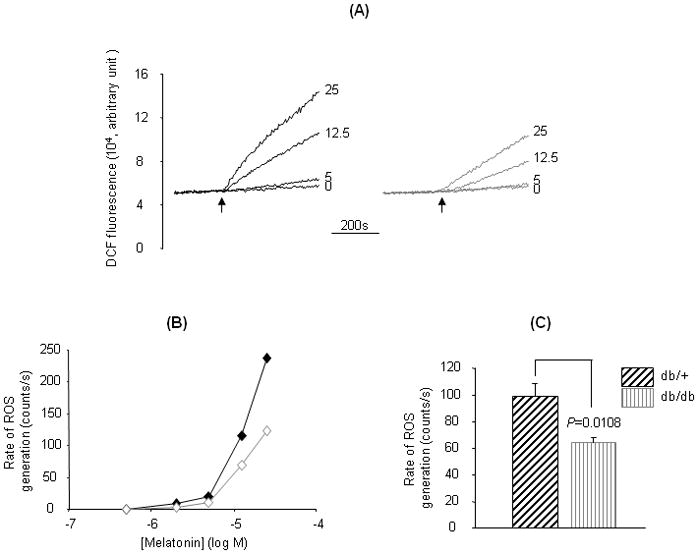
Melatonin-induced ROS generation in kidney mitochondria. Kidney mitochondria from 5-month old db/db and db/m mice were prepared and labeled with X-rhod-1 (2μM) (the data of this measurement was not shown) and DCF (1 μM) (37°C, 30 min), and melatonin-induced ROS generation was measured by increased DCF fluorescence. Traces in (A) represent typical responses of ROS generation to different concentrations of melatonin in kidney mitochondria of db/db (right panel) or db/m mice (left panel). Plots in (B) compare changes in the rate of ROS generation between db/db (open symbol) and db/m (solid symbol) mice in response to increasing melatonin concentrations from a typical experiment. Values in (C) are mean±SE rates of ROS generation in response to 25 μM melatonin. *P=0.0109 db/db vs db/m, n=8.