
Fig. 4.
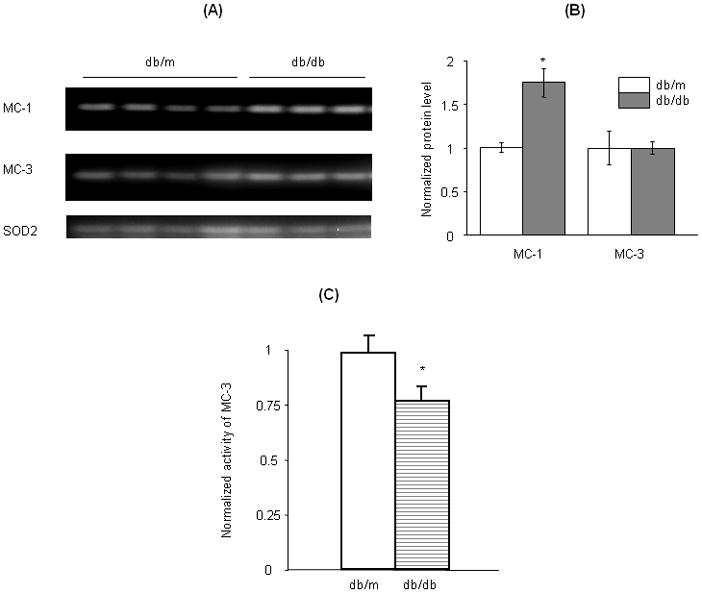
Expression of mitochondrial complexes in the kidney of db/db and db/m mice. Western blot analysis was performed to compare the protein levels of mitochondrial complexes I (MC-1) and III (MC-3) in kidneys of db/db and db/m mice (A and B). The activity of MC-3 was assessed with exogenous decylubiquinone and cytochrome C (>95% oxidized) as described (14) and the results are shown in (C). *P<0.05 db/db vs db/m.