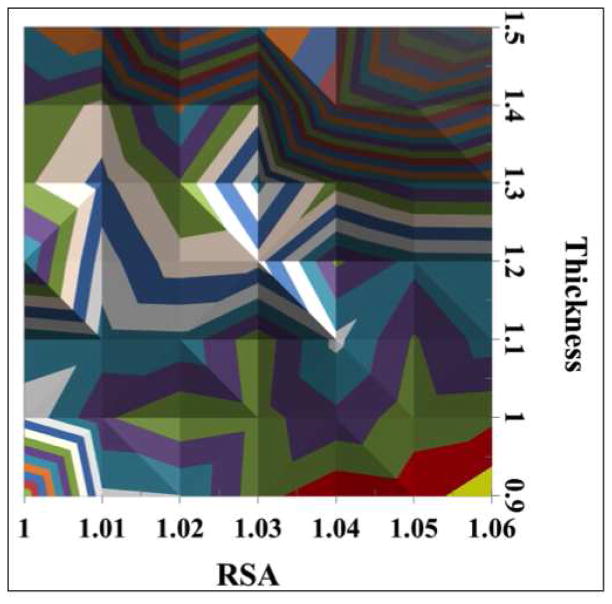
Figure 6.
ΣXr2(N) comparison of XPS% with the SESSA% using Equation 2. The XPS data is from the C16 COOH-SAM on 14nm AuNPs. The SESSA data is from the C16 COOH-SAM on a flat Au surface, summed across all nine photoelectron emission angles using the geometric weighting factors. For the SESSA calculations the RSA and CH2-group thickness were varied and a 1.5Å thick hydrocarbon contamination overlayer was included in all calculations.

