
Figure 1.
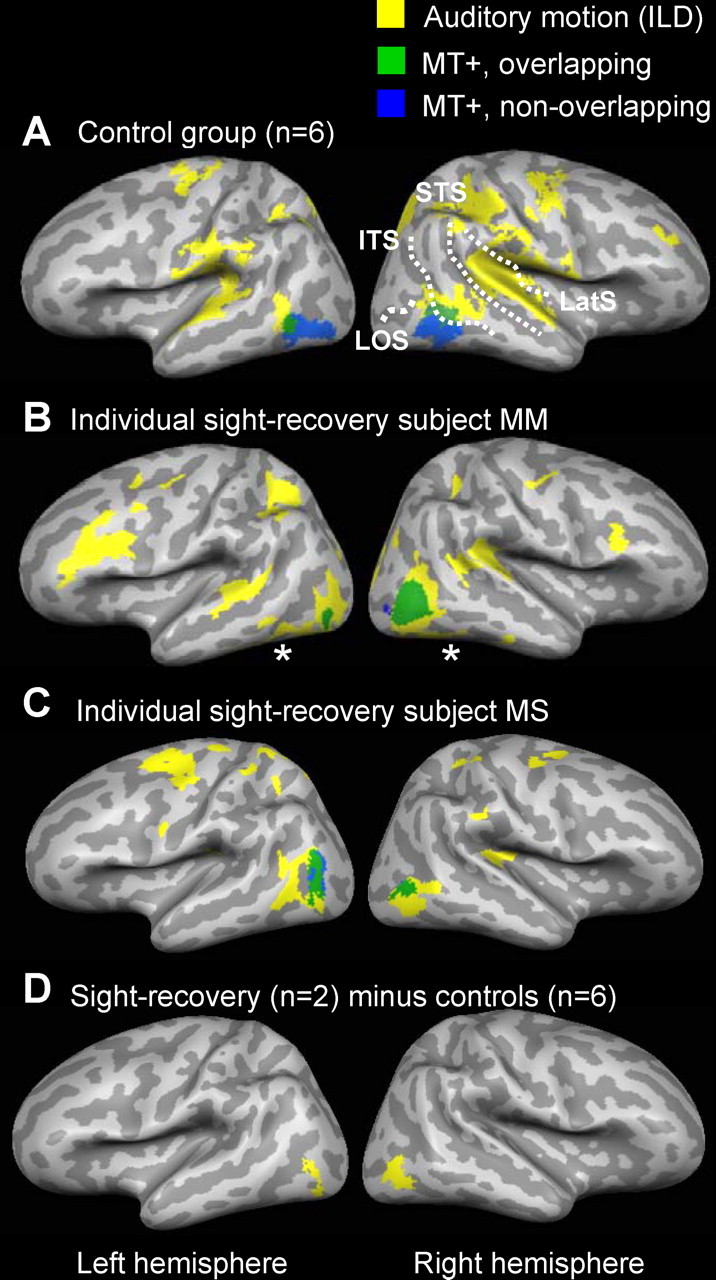
Experiment 1: surface maps of auditory ILD motion responses and MT+. A–C, Yellow regions responded more to moving (ILD) versus stationary auditory white noise in the control group (A), subject M.M. (B), and subject M.S. (C). Statistical activation maps are the result of a fixed-effects GLM analysis [q(FDR) < 0.01]. Green and blue regions show MT+ location as determined by visual MT+ localizer scans run in the same subjects (green, MT+ overlapped by auditory ILD motion responses; blue, MT+ not overlapped by auditory ILD motion responses). Note the near-complete overlap (very little blue) in subjects M.M. and M.S. indicating colocalization of auditory ILD responses with their visually defined MT+. D, A subtraction analysis shows regions more activated by auditory ILD motion (vs stationary) in sight-recovery subjects compared with controls [q(FDR) < 0.05]. Data from all subjects are projected onto a single anatomical image (inflated cortical surface) using cortex-based alignment. LatS, Lateral sulcus.