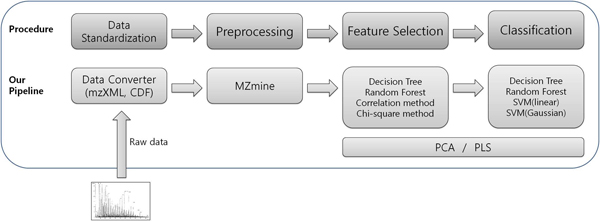
Figure 2.
An overview of the analysis procedure used to construct classification models based on metabolome datasets The procedure consists of four stages; data standardization, preprocessing, feature selection, and classification. The raw data from mass spectrometry machines are converted into the standard data formats mzXML [13] and CDF, and in turn preprocessed using the MZmine tool [14,15]. The data are then analyzed with various feature selection and classification techniques. For feature selection, we use chi-square as a univariate method, the correlation-based method as a multivariate method, and Decision tree and Random forest as classifier-embedded methods. For classification, we use Decision tree and Random forest as tree-based non-parametric methods and Support vector machine (SVM) as a generalized linear discriminative method. (An Artificial neural network (ANN) is not used here, since it is known that the ANN has weak points in many cases, compared to the SVM [18,19].) The dimension reduction methods PCA and PLS are used for visualizing overall distributions of given data.

