
Fig. 2.
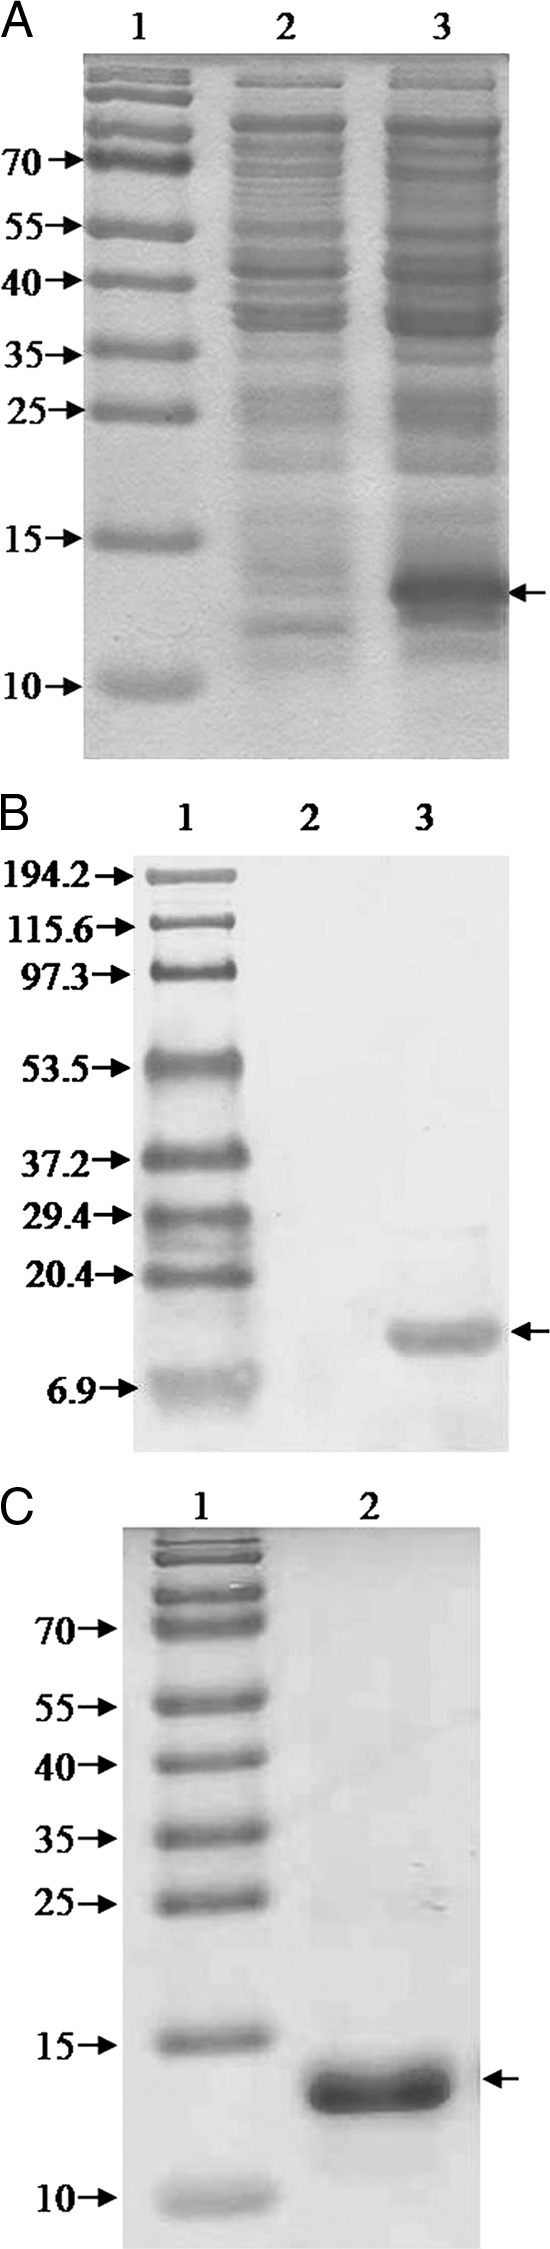
SDS-PAGE analysis of BimA protein expression (A) and its reactivity with anti-His antibody (B). Lane 1, protein molecular mass marker (in kilodaltons); lane 2, uninduced cells; lane 3, IPTG-induced cells. The arrow at the right of each panel indicates the position of the rBimA protein. (C) SDS-PAGE (15%) profile of the purified rBimA protein. Lane 1, protein molecular mass marker (in kilodaltons); lane 2, purified rBimA protein.