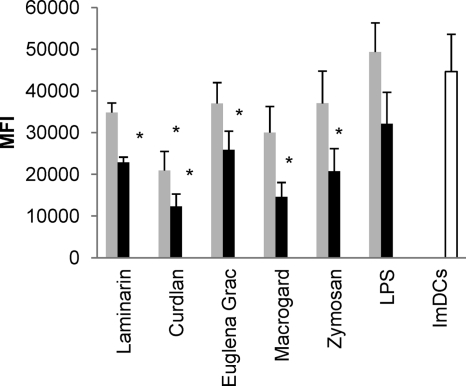
Fig. 2.
Analysis of the phagocytic activity of β-glucan-stimulated MoDCs. Immature MoDCs were stimulated with 5 μg ( ) or 10 μg (▪) of β-glucan/ml or LPS (1 and 10 μg/ml), and the uptake of ova-dQ was assayed by flow cytometry. Mean fluorescence intensity (MFI) values were calculated by subtracting the MFI values obtained at 4°C from those obtained at 37°C. The data are shown as the means ± the SEM for four pigs. Asterisks (*) indicate a significant difference between β-glucan-stimulated MoDCs and immature MoDCs (ImDCs) (for all β-glucans P < 0.01 except for the β-glucan from Euglena gracilis).

