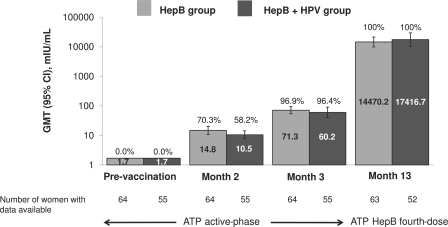
Fig. 3.
Seroprotection rates (values above the bars) and GMTs (values inside the bars) for anti-HBs antibodies in women initially seronegative before vaccination. Data are shown for the ATP active-phase cohort for prevaccination, month 2, and month 3 time points and for the ATP HepB fourth-dose cohort at the month 13 time point.

