Fig. 1.
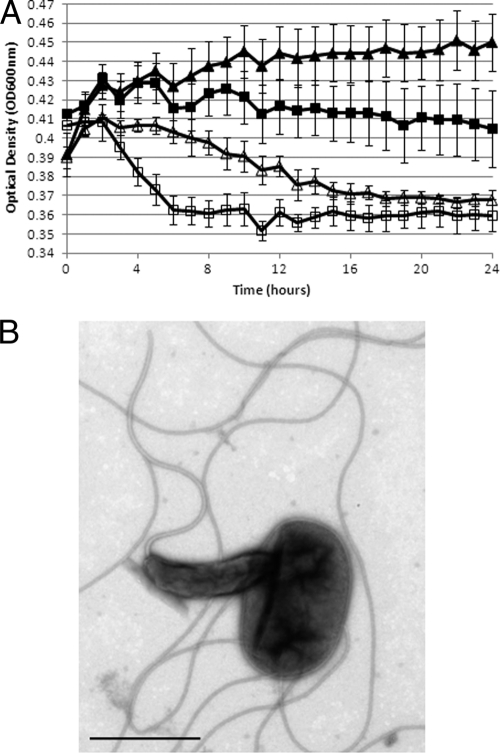
(A) Predatory kill curves of E. coli S17-1 and S. Enteritidis P125109 by B. bacteriovorus HD100. Curves show the optical density (at 600 nm) of E. coli with heat-killed Bdellovibrio (solid squares), E. coli with live predatory Bdellovibrio (open squares), Salmonella with heat-killed Bdellovibrio (solid triangles), and Salmonella with live predatory Bdellovibrio (open triangles). Predatory Bdellovibrio was added to late-log-phase prey (either E. coli S17-1 or S. Enteritidis P125109), diluted in Ca-HEPES buffer, and incubated aerobically at 29°C with shaking at 200 rpm. A small amount of prey replication occurred due to the carryover of remaining nutrients within the prey cultures, but this growth was limited due to the dilution of the prey into the nonnutrient Ca-HEPES buffer. The drop in OD600 reflects the successful predation on, and lysis of, the prey cells both early (during the small amount of prey growth) and later during the incubation period when the prey cells entered stationary phase. Each point represents the means from three biological repeats, and error bars show the standard errors above and below the means. (B) A B. bacteriovorus HD100 cell entering an S. Enteritidis P125109 prey cell. Cells were stained with 0.5% uranyl acetate (URA), pH 4.0. The scale bar represents 1 μm.

