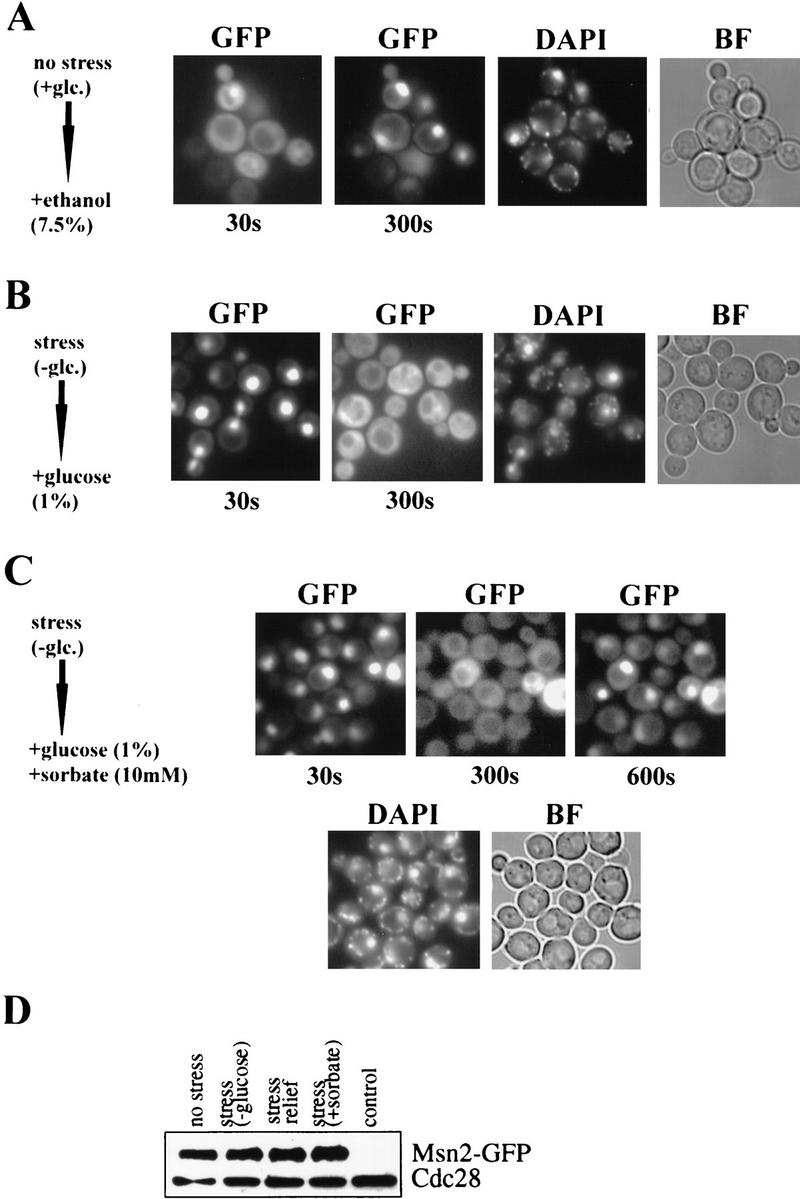
Figure 3.

Dynamic distribution of Msn2p–GFP in W303 msn2 msn4 cells transformed with pAdh1–Msn2–GFP. Import (A): Cells were grown to early logarithmic phase, treated with 7.5% ethanol and pictures were taken after 30 and 300 sec. Export (B): Cells were starved for carbon source and glucose (1%) was added. Pictures were taken after 30 and 300 sec. Import–export (C): Msn2p–GFP distribution in a group of carbon-starved cells after simultaneous addition of 1% glucose and 10 mm sorbic acid (30, 300, and 600 sec). In all cases, DAPI fluorescence was recorded immediately after the final GFP recording. (D) Western blot showing amounts of Msn2p–GFP in extracts from cells grown under conditions described in B and C.
