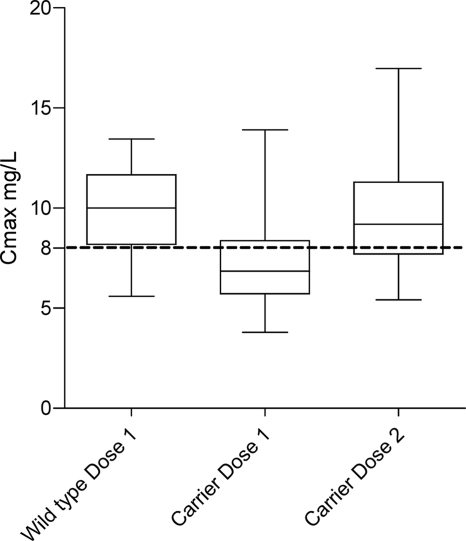
Fig. 4.
Box (interquartile range)-and-whisker (95th percentiles) plot of simulated variation in the Cmax based on the final model, with weight, sex, and genotype distributions in our data set. Simulations were performed by using the currently recommended doses (dose 1), and a genotype-based dose whereby SLCO1B1 rs41490932 carriers received an additional 150 mg of rifampin daily (dose 2).

