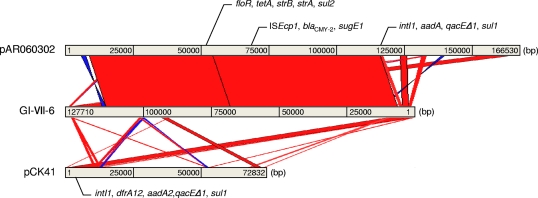
Fig. 3.
Schematic representation of multidrug resistance determinants. Pairwise comparison of GI-VII-6 in S. Typhimurium isolate L-3553 with E. coli plasmid pAR060302 and E. tarda plasmid pCK41 by BLASTN homology search and visualized by the ACT program. The red and blue bars between the chromosomal DNA lines shown in gray represent individual nucleotide matches with forward or reverse direction, respectively. BLASTN match scores less than 200 are not shown.

