
Figure 6.
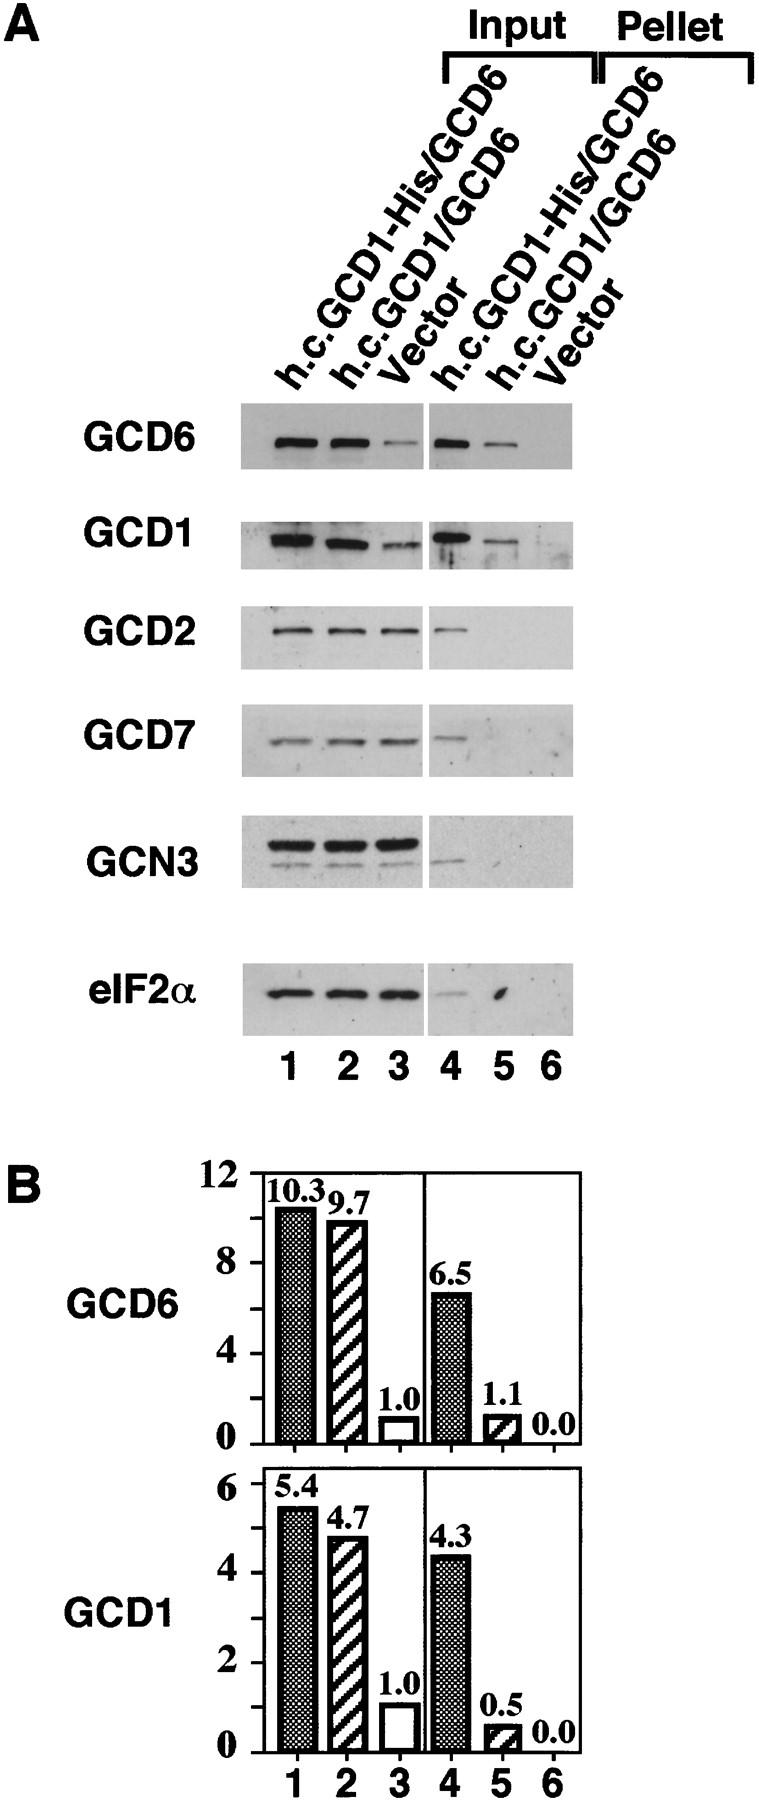
Subcomplex formation between His-tagged GCD1 and GCD6. Ni-NTA–silica affinity chromatography of whole-cell extracts from strains co-overexpressing His-tagged GCD1 and wild-type GCD6 (lanes 1,4), co-overexpressing wild-type GCD1 and GCD6 (lanes 2,5), or carrying only the plasmid vector (lanes 3,6). (A) Western blot analysis of the binding of eIF2B subunits from 120 μg of cell extracts to Ni–NTA–silica resin (lanes 4–6) and from 10 μg of each cell extract input (lanes 1–3). (B) Histograms showing densitometry of signals for GCD1 and GCD6 antiserum from A relative to the density of the signal in lane 3, which was assigned an arbitrary value of 1.