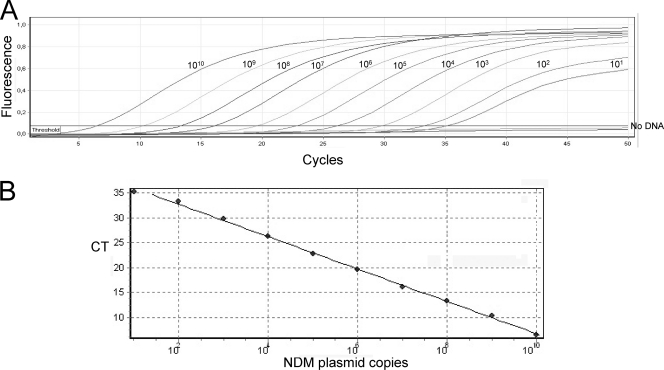
Fig. 1.
Amplification curve (A) and standard curve (B) of blaNDM-1 qPCR assay using serial (10-fold) dilutions of recombinant plasmid DNA harboring blaNDM-1. CT values were obtained for each dilution and plotted against the number of plasmid copies per reaction. The numbers above each amplification curve correspond to the plasmid copy number present in the PCR mixture.

