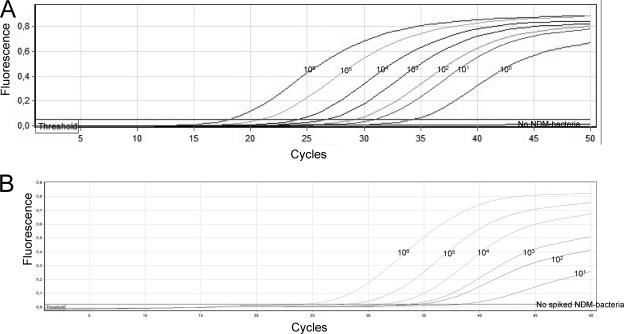
Fig. 2.
(A) Amplification curves of blaNDM-1 qPCR assay using serial (10-fold) dilutions of NDM-1-producing K. pneumoniae A in the reference E. coli Ec1 isolate. The numbers above each amplification curve correspond to the theoretical numbers of bacterial CFU present in each PCR. (B) NDM-1-producing E. coli B in fecal samples. The numbers above each amplification curve correspond to the theoretical bacterial count/ml of fecal suspension, which corresponds to about 100 mg of feces.

