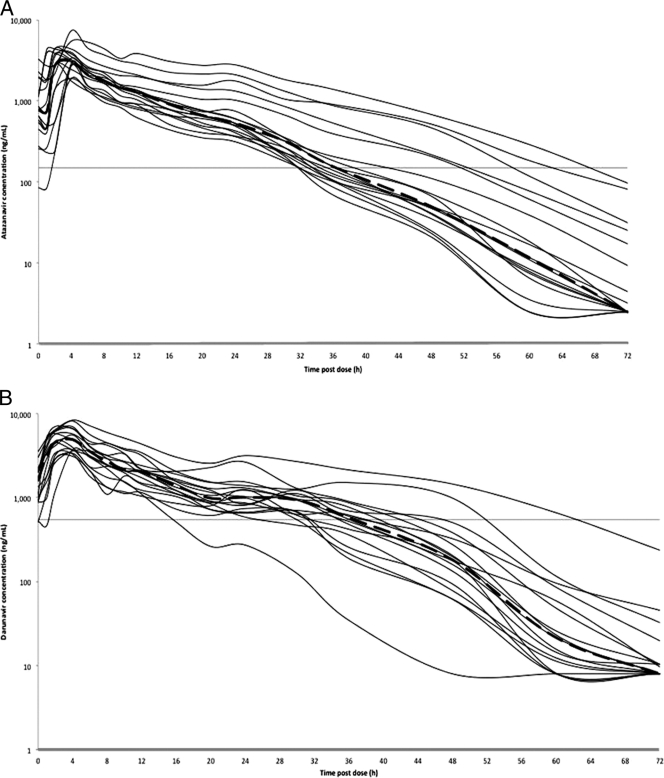
Fig. 1.
Steady-state plasma concentrations from all studied subjects and geometric mean concentration-time curves (black thick lines) of darunavir (darunavir-ritonavir at 800 and 100 mg, respectively, once daily) (A) and atazanavir (atazanavir-ritonavir at 300 and 100 mg, respectively, once daily) (B). Horizontal lines indicate the targets used in this analysis: 550 ng/ml for darunavir and 150 ng/ml for atazanavir.

