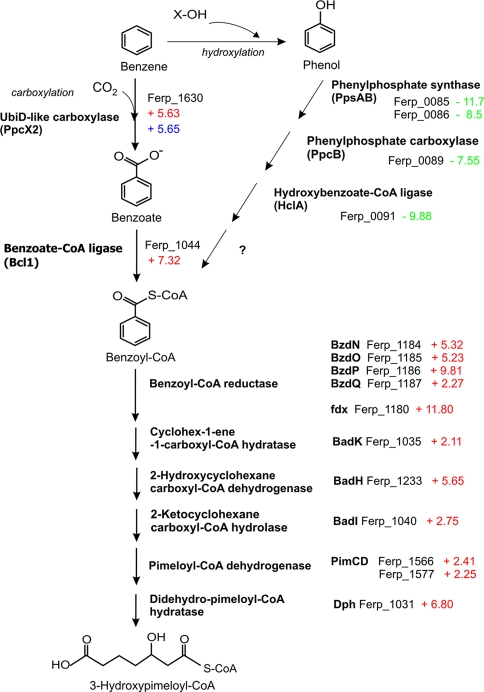
Fig. 4.
Transcriptomic analysis of benzene degradation in F. placidus. The numbers next to the gene designations represent the fold change in transcript abundance determined with quantitative RT-PCR analyses in benzene- versus acetate-grown cells (red), benzene- versus phenol-grown cells (green), or benzene- versus benzoate-grown cells (blue). The results are the means of triplicate determinations from each of three replicate cultures.

