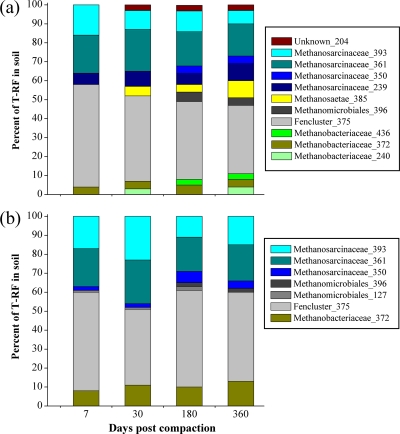
Fig. 5.
Changes over time in the abundance of methanogen subgroups recovered from severely compacted forest soils (5-cm soil depth) from the Ermatingen (a) and Heiteren (b) sites at four different time points (7, 30, 180, and 360 days after traffic). The relative abundance of T-RFs was used as a measure of the composition of the mcrA community. mcrA gene-based T-RFLP profiles were created with Sau96I as a restriction enzyme. T-RFs of 239, 350, 361, and 393 bp are representative of Methanosarcinaceae; T-RFs of 127 and 396 bp are representative of Methanomicrobiales; a T-RF of 375 bp is representative of Fencluster within Methanomicrobiales; T-RFs of 240, 372, and 436 bp are representative of Methanobacteriaceae; and a T-RF of 385 bp is representative of Methanosaetae. A T-RF of 204 bp could not be affiliated with any clone sequences.

