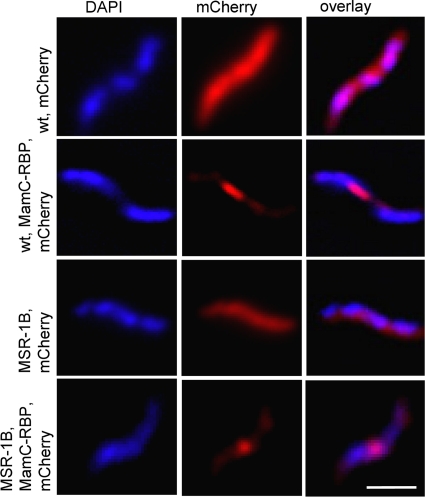
Fig. 4.
Fluorescence micrographs of representative cells of M. gryphiswaldense WT expressing pAP182 and pAP183 and M. gryphiswaldense strain MSR-1B expressing pAP182 and pAP183. Left: DAPI fluorescence signals. Middle: mCherry signal from the same cell. Right: overlay of DAPI (blue) and mCherry (red) signals. Bar, 3 μm.

