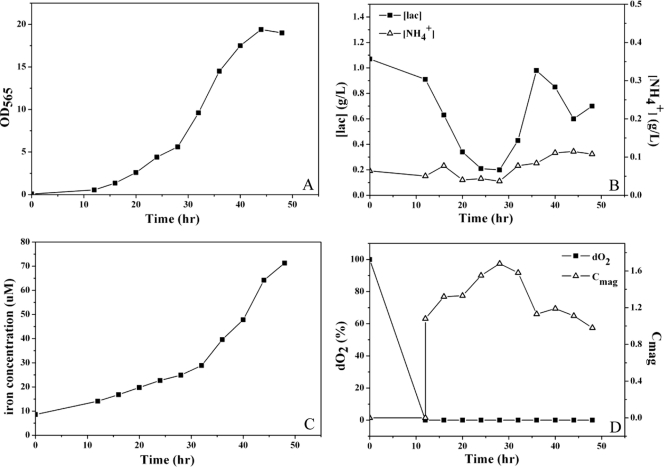
Fig. 1.
Fed-batch culture of M. gryphiswaldense strain MSR-1 cells in a 7.5-liter autofermentor supplemented with feed B (see the text). (A) Cell growth curve. The cell density (i.e., the OD565) reached a maximum of 19.4 at 44 h. (B) Concentrations of lactate (▪) and NH4+ (▵). Each was controlled at a low level suitable for cell growth. (C) The Fe2+/Fe3+ concentration in fermentor increased with time but remained within the cell tolerance range. (D) Relation of Cmag (▵) and dO2 (▪). The Cmag increased rapidly as dO2 declined to 0% at 12 h, but then decreased in the late logarithmic phase and the stationary phase.

