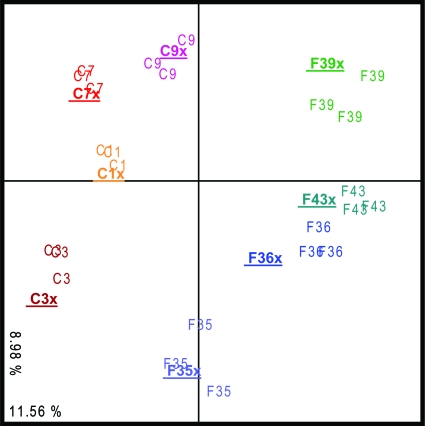
Fig. 2.
Similarity between community profiles. The diagram shows a correspondence analysis of the Bacteria profiles generated by both strategies (“x” denotes the two-step approach profiles, which are also indicated with boldfacing and underlining). C; cecum samples, F; feces samples. Profile numbers denote sample origin. Values in the x and y axes correspond to percentages of total variance.

