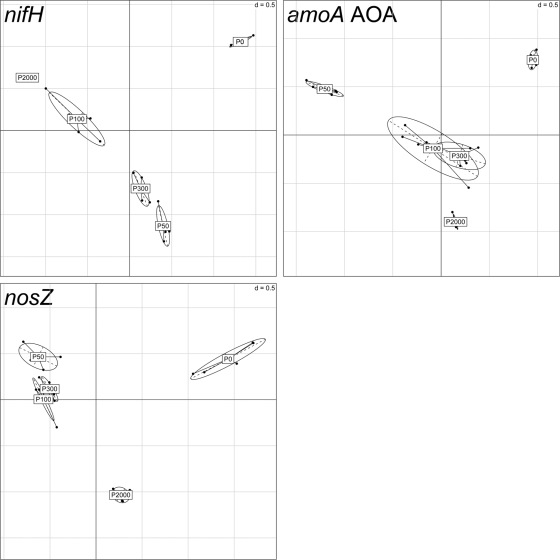
Fig. 2.
Between-group analysis based on correspondence analysis of the T-RFLP data set for nifH, amoA AOA, and nosZ gene fragments. The first two axes explain 66.8 to 80.0% of variance. Symbols illustrate the five field replicates for each soil (P0, P50, P100, P300, and P2000). Ellipses surround the 5 replicates for each soil, showing that they cluster together.

