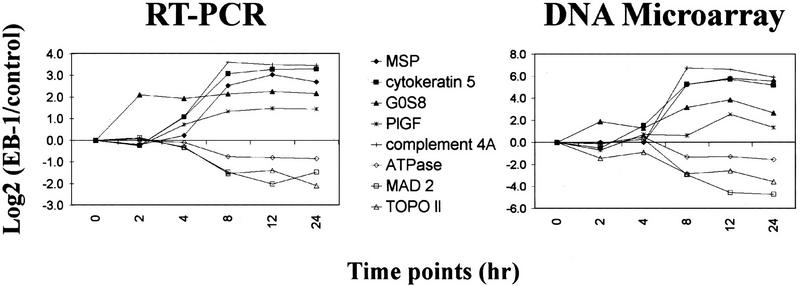
Figure 5.
Independent measurements of selected gene expression levels by RT–PCR (left) and p53-spotted oligonucleotide arrays (right). Expression levels measured by RT–PCR were normalized to GAPDH and plotted relative to the level in control cells. Both methods gave very similar results in the gene expression profiles.

