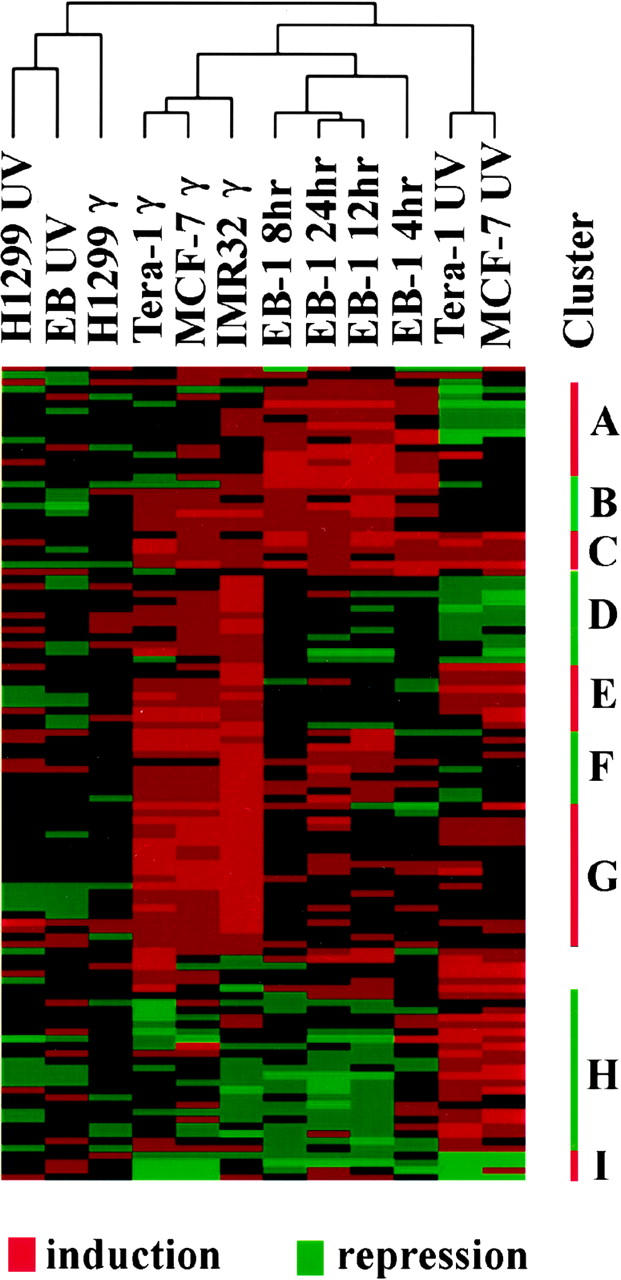
Figure 7.

Cluster analysis of gene expression patterns after UV or γ irradiation. A total of 112 genes and 5 different cell lines following indicated radiation were included in this analysis. This analysis was performed in two dimensions, with one for cell lines and radiation, the other one for 112 genes. Cells with wild-type p53 fall into distinct clusters following different irradiation. The 112 genes were clustered into 9 groups with different expression patterns in cells with wild-type p53 following different types of radiation.
