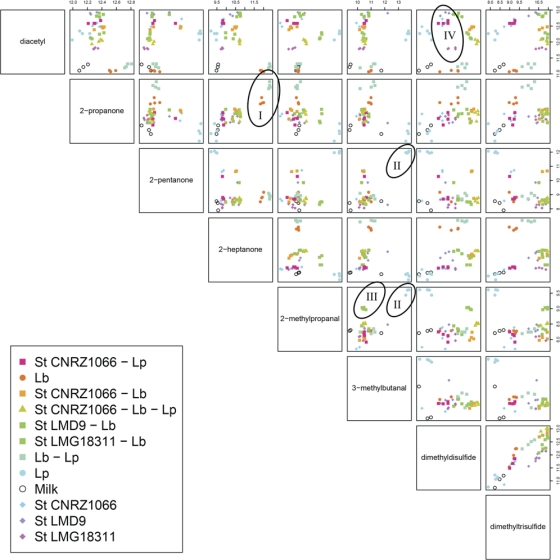
Fig. 2.
Pair plot showing the differences in levels of volatile compounds detected in fermented milk cultures. The same data as in Fig. 1 were used. The compounds displayed are those corresponding to mass peaks of which the Random Forest analysis indicated that they were most important in discriminating sample types. Names of compounds in the squares on the diagonal indicate the compound displayed on the axes in the rows or columns of graphs intersecting with that square. Every pair of compounds is displayed once. The scales display the compound peak areas on a logarithmic scale, and the level increases from left to right (upper scale bar) and from bottom to top (right scale bar). The pair plot visualizes which compounds, or combinations of compounds, allow discrimination of individual groups. The pair plot shows, for instance, that a high concentration of 2-propanone is highly discriminative for the combination of Lb. plantarum and Lb. delbrueckii subsp. bulgaricus and pure Lb. delbrueckii subsp. bulgaricus cultures (I), whereas high concentrations of 2-pentanone, 2-methylbutanal, and 2-methylpropanal are characteristic of pure L. plantarum cultures (II). The pair plot can also be used to visualize correlations between different compounds. For instance, the levels of dimethyldisulfide and dimethyltrisulfide seem to be positively correlated. St, S. thermophilus; Lp, Lb. plantarum WCFS1; Lb, Lb. delbrueckii subsp. bulgaricus ATCC BAA365. Marked symbols I to IV are explained in Results.

