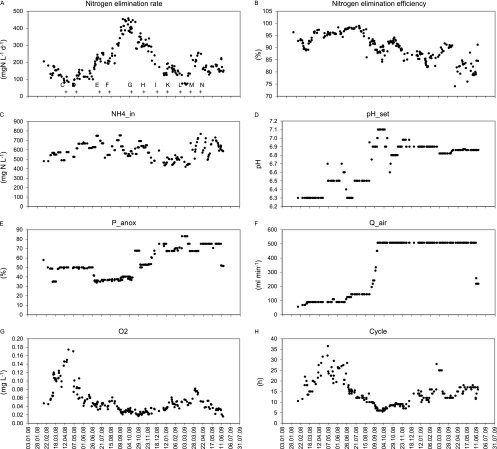
Fig. 2.
Time series for several process indicators. Nitrogen elimination rate (A) and nitrogen elimination efficiency (B) are measures for the reactor performance. NH4+ in the influent is an independent environmental variable (C). pH_set (D), P_anox (E), and Q_air (F) are independent process parameters controlled by the operator. O2 (G) and Cycle (H) are response variables which depend on environmental variables and process parameters. The plus signs in panel A indicate the sampling dates for microbial community analysis, and letters indicate sample designations. Samples A and B (not shown) were taken in 2007.

