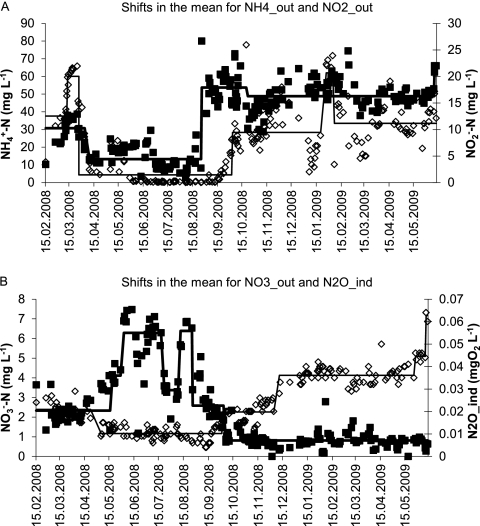
Fig. 3.
Regime-shift analysis of the temporal trends in the concentrations of NH4+ (NH4_out; black squares) and NO2− (NO2_out; empty diamonds) in the outflow (A) and nitrate (NO3_out; black squares) in the outflow and the maximum N2O in the rector extracted from O2 sensor data (N2O_ind; empty diamonds) (B). Solid lines indicate statistically significant regimes determined using sequential regime-shift detection with the parameters probability equal to 0.001, cutoff length equal to 10, and Huber parameter equal to 1.

