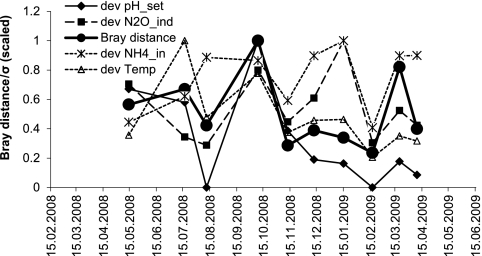
Fig. 5.
Time series analysis of Bray distance based on ARISA community fingerprints compared to time series of standard deviations (dev, σ) plotted for important driving variables according to redundancy analysis. The Bray distance graph plots the Bray dissimilarity metric of each sample to the previous sample. The time series of standard deviation plots the standard deviation of all measurements from the time interval between the date closest to the microbial sampling date and the previous microbial sampling date. All series are scaled to the highest value. Solid lines, significant correlations (P < 0.05) with Bray dissimilarity; dashed lines, no significant correlation.

