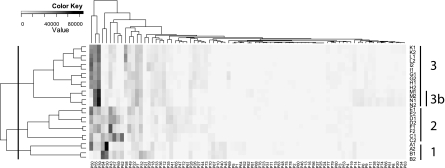
Fig. 6.
Heat map representation and hierarchical clustering of ARISA community fingerprints. Row labels indicate the sampling dates (see Fig. 2A) and the DNA volume used in ARISA (1 = 1 liter, 2 = 0.5 liter), and columns correspond to ARISA peaks (phylotypes). Darker shading indicates a higher relative ARISA peak area, an indication of high relative abundance. Numbers on the right are cluster designations.

