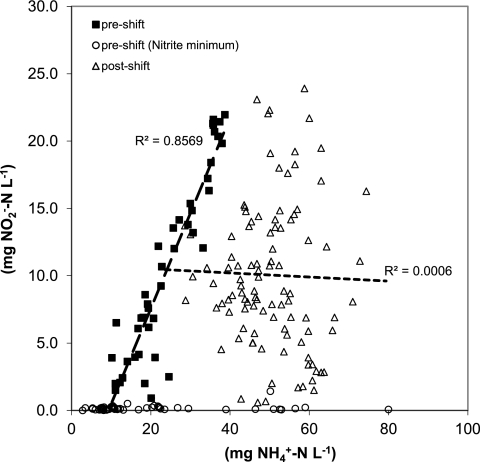
Fig. 8.
Correlation between outflow concentrations of NH4+ and NO2− before (black squares) and after (white triangles) the observed main regime shifts in nitrite and NH4+. The initially highly significant correlation (P < 0.001) breaks down completely after the regime shift. For a period of time before and during the regime shift, nitrite levels were at or below the detection limit; these values are not used in the regression (white circles).

