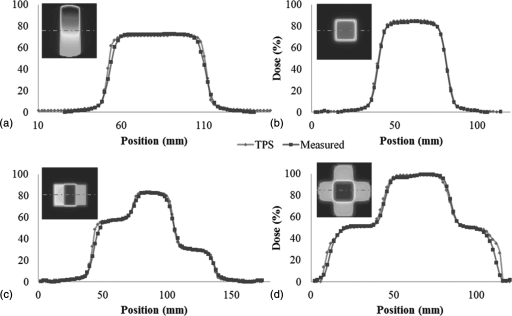
Figure 11.
Line Profiles through the first four benchmark data sets (Fig. 3) illustrate consistently high quality data, with low noise (Eclipse = diamond markers, DLOS∕PRESAGE = square markers). (A) PDD from the side, (B) PDD from the top, (C) dose plateaus, and (D) four-field-box. These profiles are un-smoothed after reconstruction, although 5 × 5 pixel median filters were applied prior to the downsizing of the original projection images to the reconstruction grid size. All profiles correspond to the middle row of pixels in the upper left panels of the image in each plot as indicated by the dashed line. In each case the noise was <2% of the maximum dose.

